An eBPF-y Addendum - How do uprobes work?

At the end of my last post I had a few open questions I kicked down the road - scope creep is as much a thing for writing as coding! Here I'll try to answer one of those - how do uprobes and uretprobes actually work? This will mainly be an adventure in debugging - if that is interesting to you, read along.
What do function calls look like in GDB?
Let's start off with a simple C app with some minimal functions in it to work out how function invocation works in assembler land. This will give us the basis we need to try and work out how the probes are injected into a process - we can compare the assembly of this with and without the probes attached.
int two_ints_and_return(int a, int b) {
        return a+b;
}

char two_chars_and_return(char a, char b) {
        return a+b;
}

int do_nothing_and_return() {
        return 0;
}

int main(int argc, char** argv) {
        int a = two_ints_and_return(0, 0);
        char b = two_chars_and_return('a', 'b');
        do_nothing_and_return();

        return 0;
}
The most exciting piece of C you have likely ever witnessed
From that, we can see what the functions look like in GDB using its disassemble command:
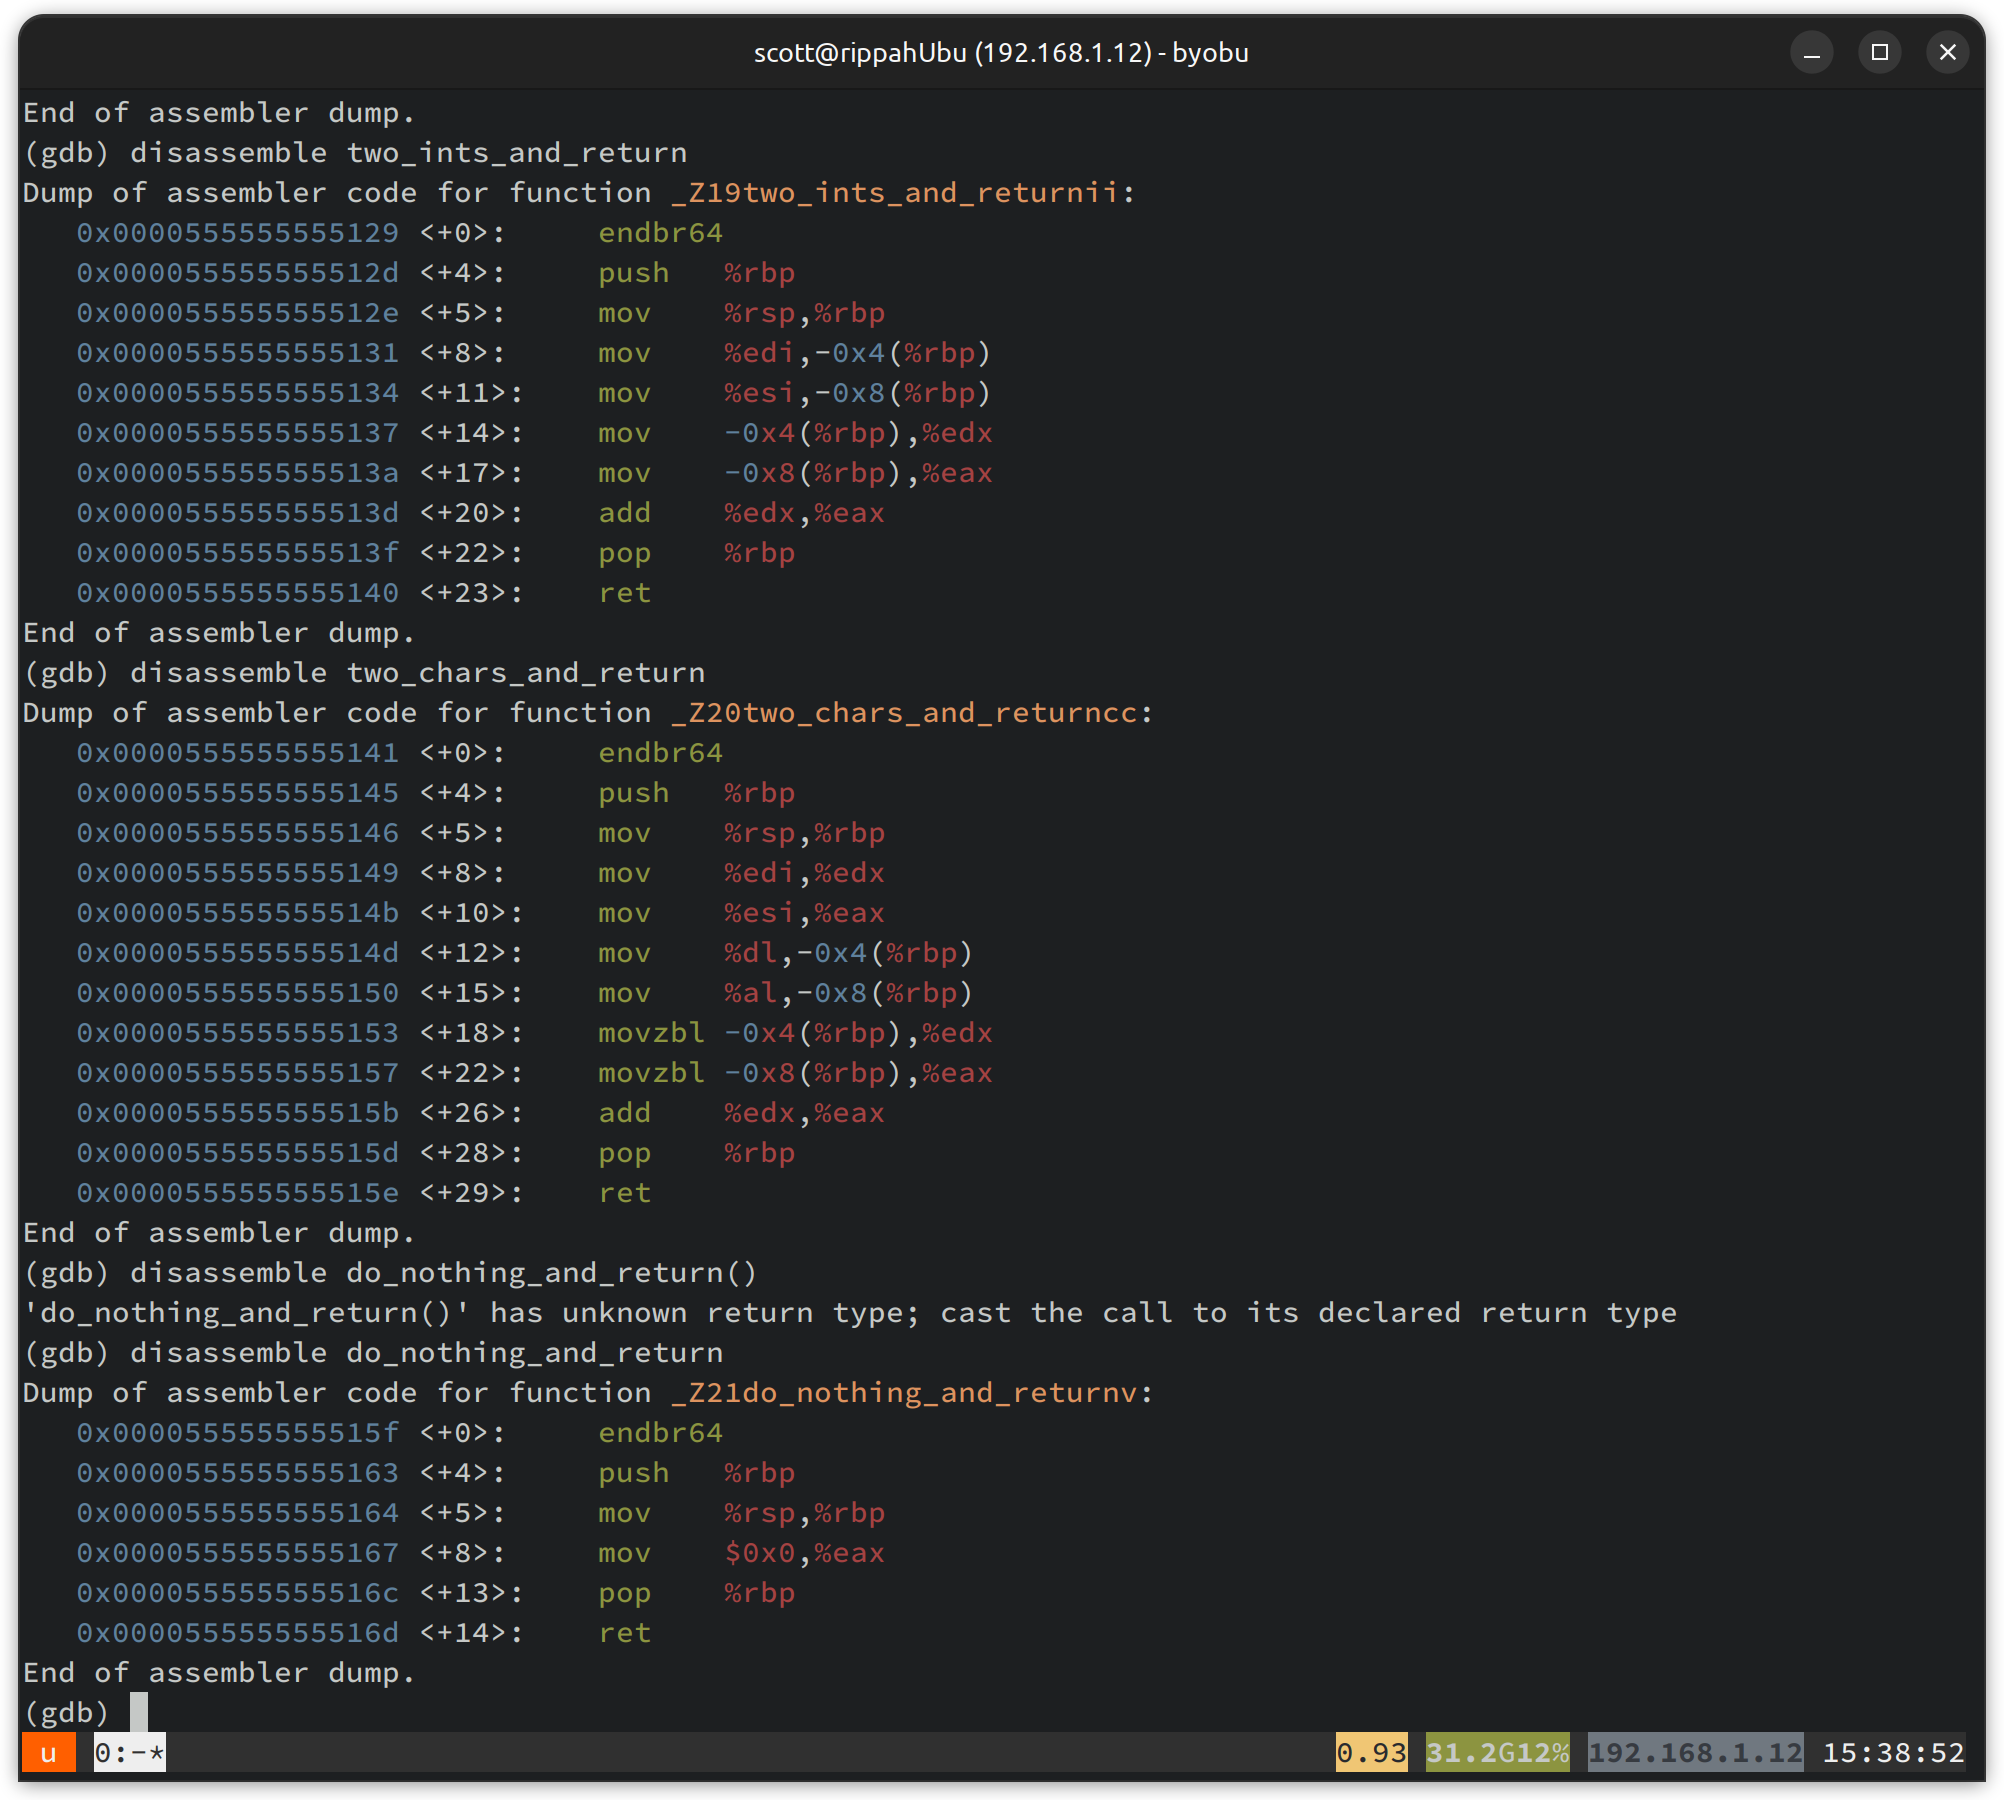
There's .... a bit to take in here. Firstly the names are mangled - z19twoints_and_returnii seems to encode some type information. I know this is a C++ specific thing, and I built with g++ . Looks like this has complicated matters for no real gain (i'm only writing C), so I will switch back to cc from now on and profit form un-manangled symbols.
Moving on - let's first pick out the common bits of the function so we know what we are dealing with:
# This is a security thing used to mark valid indirect branch targets. You always see it at the start of functions
endbr64

push   %rbp        # Save address of the caller's stack frame
mov    %rsp,%rbp   # Store current stack frame in rsp

# ...
# Function body
# ...

pop    %rbp        # Restore caller's stack frame
ret                # .... and return
To make more sense of this, we need to understand the calling convention used. I'm on an AMD64 machine, which a casual google suggests uses the System V AMD64 ABI - a helpful summary can be found on wikipedia. The important bit for our simple functions is - the first 6 arguments are passed by register - RDI, RSI, RDX, RCX, R8, R9. The names here don't line up - instead of RDI and RSI, we see EDI and ESI. This is because we are only using the low 32 bits of the registers - e.g., "EDI" is the low 32 bits of "RDI". Because we are 64 bit, but are passing 32 bit integers about, we don't need the whole register.
So, the register reading for the two functions happens like this:
# two_ints_and_return
mov    %edi,-0x4(%rbp)
mov    %esi,-0x8(%rbp)

# two_chars_and_return
mov    %edi,%edx
mov    %esi,%eax
mov    %dl,-0x4(%rbp)
mov    %al,-0x8(%rbp)
In the char function, we can see that we pass the arguments using the low-32 bits of the registers even though they are only 1 byte, and then we read out the single byte of that onto the stack, using the low 8 bits of the register. A full chain for clarity from 64 bit back to the lowest 8 bits is RDI -> EDI -> DL.This naming pattern is used for all 64/32/8 register relationships. breakpoint details
So what about breakpoints?
I spent a bunch of time trying to see GDB inserting breakpoints. I know that it does this by overwriting the first instruction in a function with a software interrupt (typically int3), catching that interrupt, then plugging the correct instruction back in and rewinding the execution pointer to run back over it. I figured you'd be able to see that in the assembly, at least by disassembling the processes memory around the function after setting a breakpoint. After a lot of fiddling about it really seems like you can't - GDB goes to lengths to pretend that it hasn't modified the instruction at the breakpoint address. If anyone knows a way of seeing the INT3 in the processes memory - let me know!
I'm still waiting - how do uprobes work?
Let's use our knowledge of the functions above and how they look in GDB-land to work it out! I'll start by writing some extremely simple probes - both a uprobe and uretprobe - that we can hook to two_ints_and_return, in the same fashion as the last blog post:
SEC("uprobe/probe-ent")
int probe_function_entry(struct pt_regs *ctx) {
	// Read args out - we can hopefully spot this in the asm
	void* buf = (void *) PT_REGS_PARM2(ctx); // RSI 'x /s $rsi'
	u64 size =  PT_REGS_PARM3(ctx); // RDX // 'p /d $rdx'

	// Do something else we can hopefully see in the asm
	int a = 1 + 2 + 3;

	return 0;
}


SEC("uretprobe/probe-ret")
int probe_function_return(struct pt_regs *ctx) {

	int a = 4 + 5 + 6;

	return 0;
}
And hook these up to the binary ...
	function_to_probe := "two_ints_and_return"
	up_ssl_write, err := ex.Uprobe(function_to_probe, objs.ProbeFunctionEntry, nil)
	if err != nil {
		log.Fatalf("creating uprob - function entry: %s", err)
	}
	defer up_ssl_write.Close()

	uretprobe_ssl_read, err := ex.Uretprobe(function_to_probe, objs.ProbeFunctionReturn, nil)
	if err != nil {
		log.Fatalf("Creating uretprobe - function exit: %s", err)
	}
	defer uretprobe_ssl_read.Close()
Pretty straightforward! Let's launch the eBPF program, then attach a debugger and dump the function out:
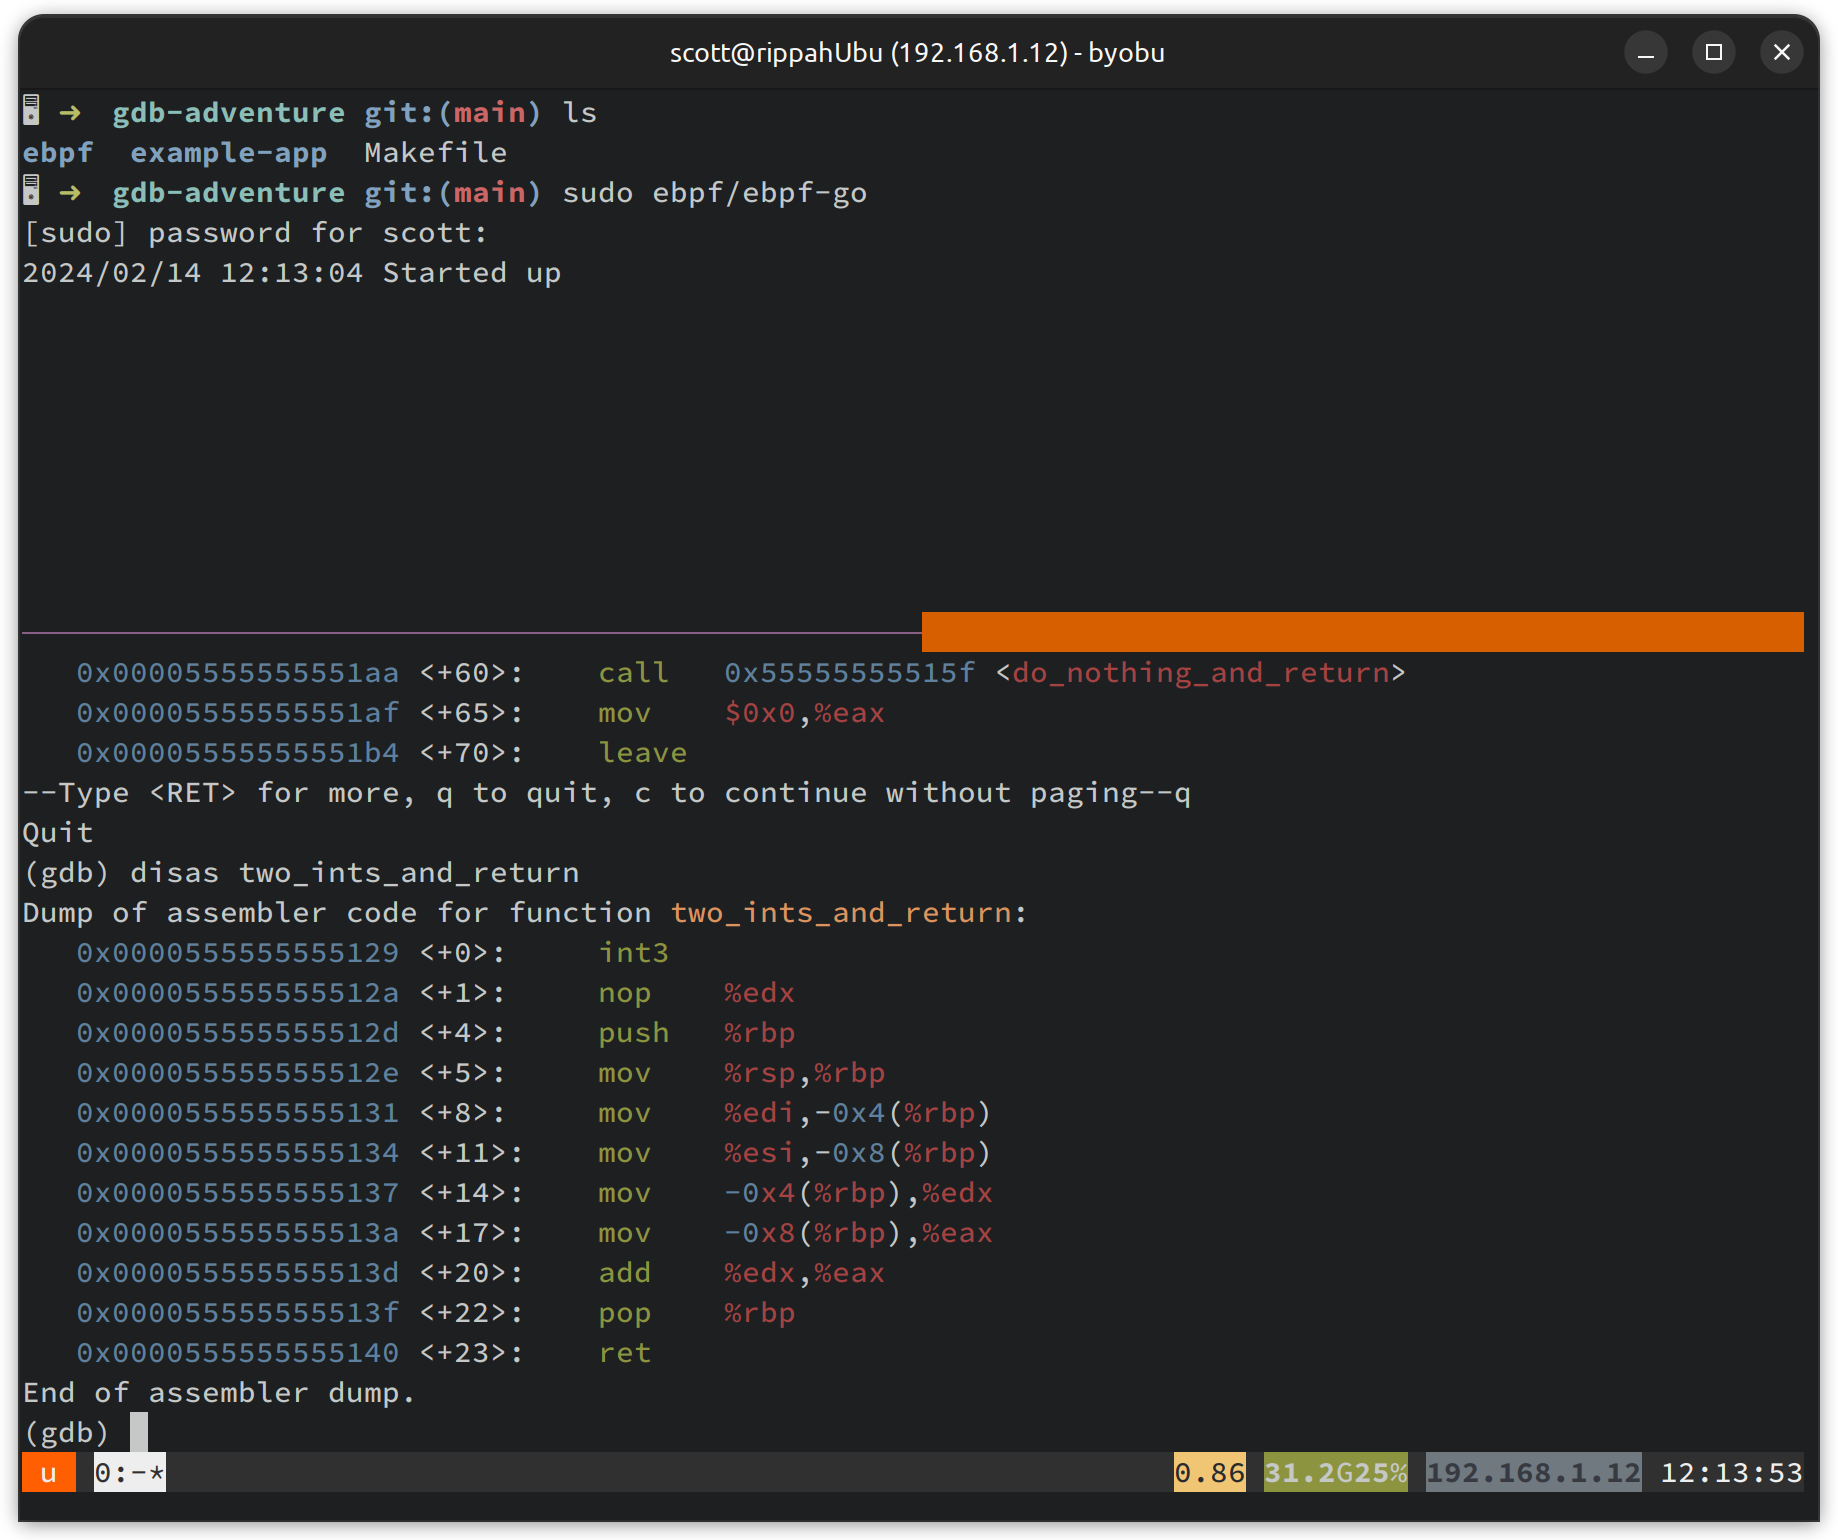
Look - an int3 - that wasn't there before! We can't see the code itself that we've added, but we can see that the kernel appears to have injected a soft interrupt in for itself. If we disas two_chars_and_return, which we have not attached probes to, the interrupt is not there. info breakpointsalso does not mention this int3, so we can confidently say it is the kernel's doing and not something with GDB. We can see that the stack pointer push is always +4 from the start of the function, which explains why we also have the nop %edx in there - the kernel has subbed out the whole endbr64 and "filled in" the free space with a no-op, so the rest of the function doesn't have to shift about.
What about the uretprobe, though? Nothing has changed at the end of the function - we just have the int3 at the start.
Perhaps we can work it out by seeing where ret is going to take us, at +23, the last instruction in the function. Notionally this should take us back to main, but maybe something funny has happened to the stack. I know I can easily compare the stack frames - recompiling with symbols (-g) and then using bt to get a backtrace - what do we see?
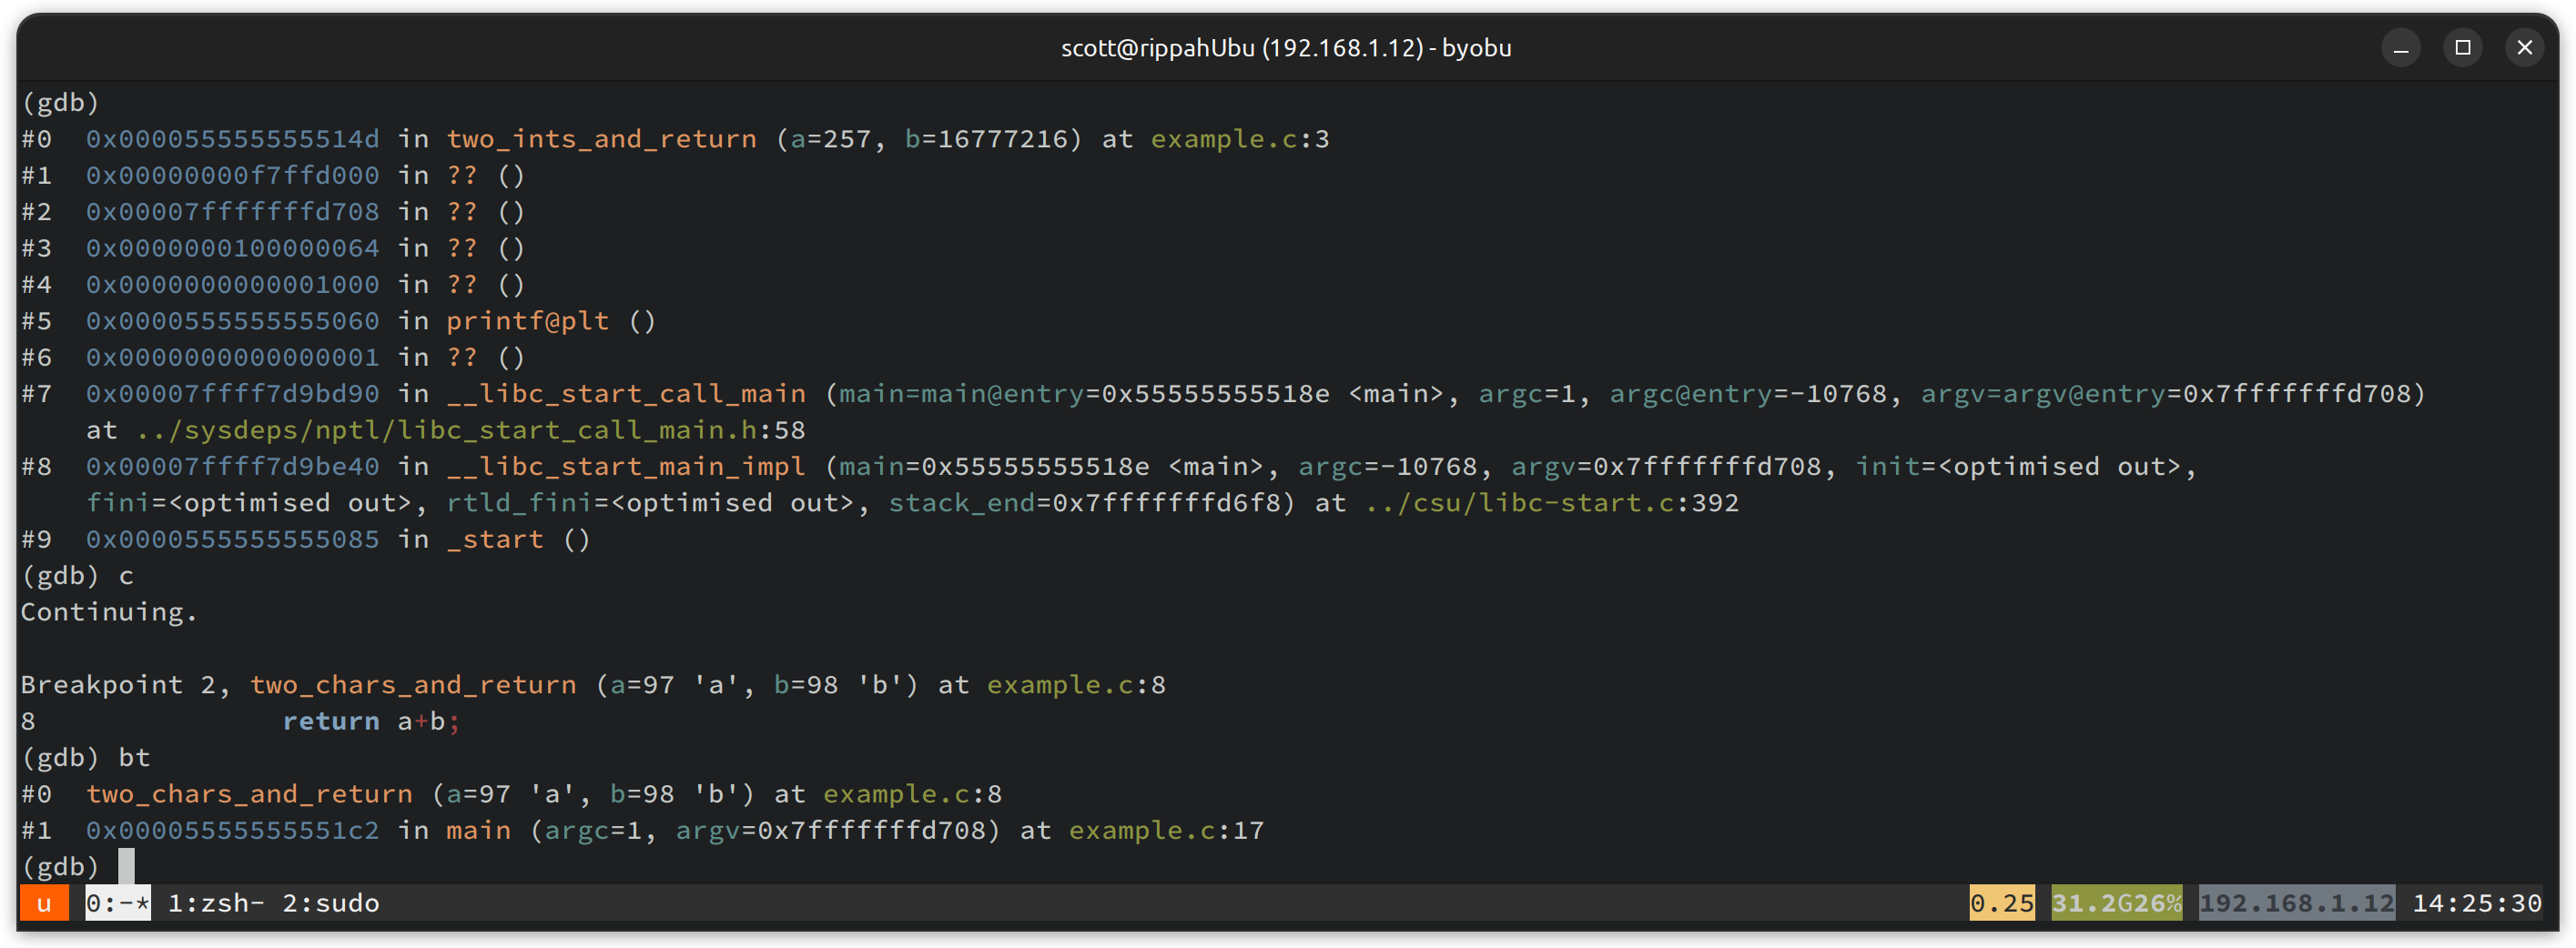
Well - that's weird. When we go through two_ints_and_return, which has a uretprobe on it, we have a fairly wild stack, which doesn't even lead back through main! Contrast this with two_chars_and_return, which has no probes attached, and everything looks normal. When we ret out of the function, we aren't jumping directly back to main, which suggests uretprobe must be implemented by manipulating the stack. What if we try and step out of the function, after the ret?
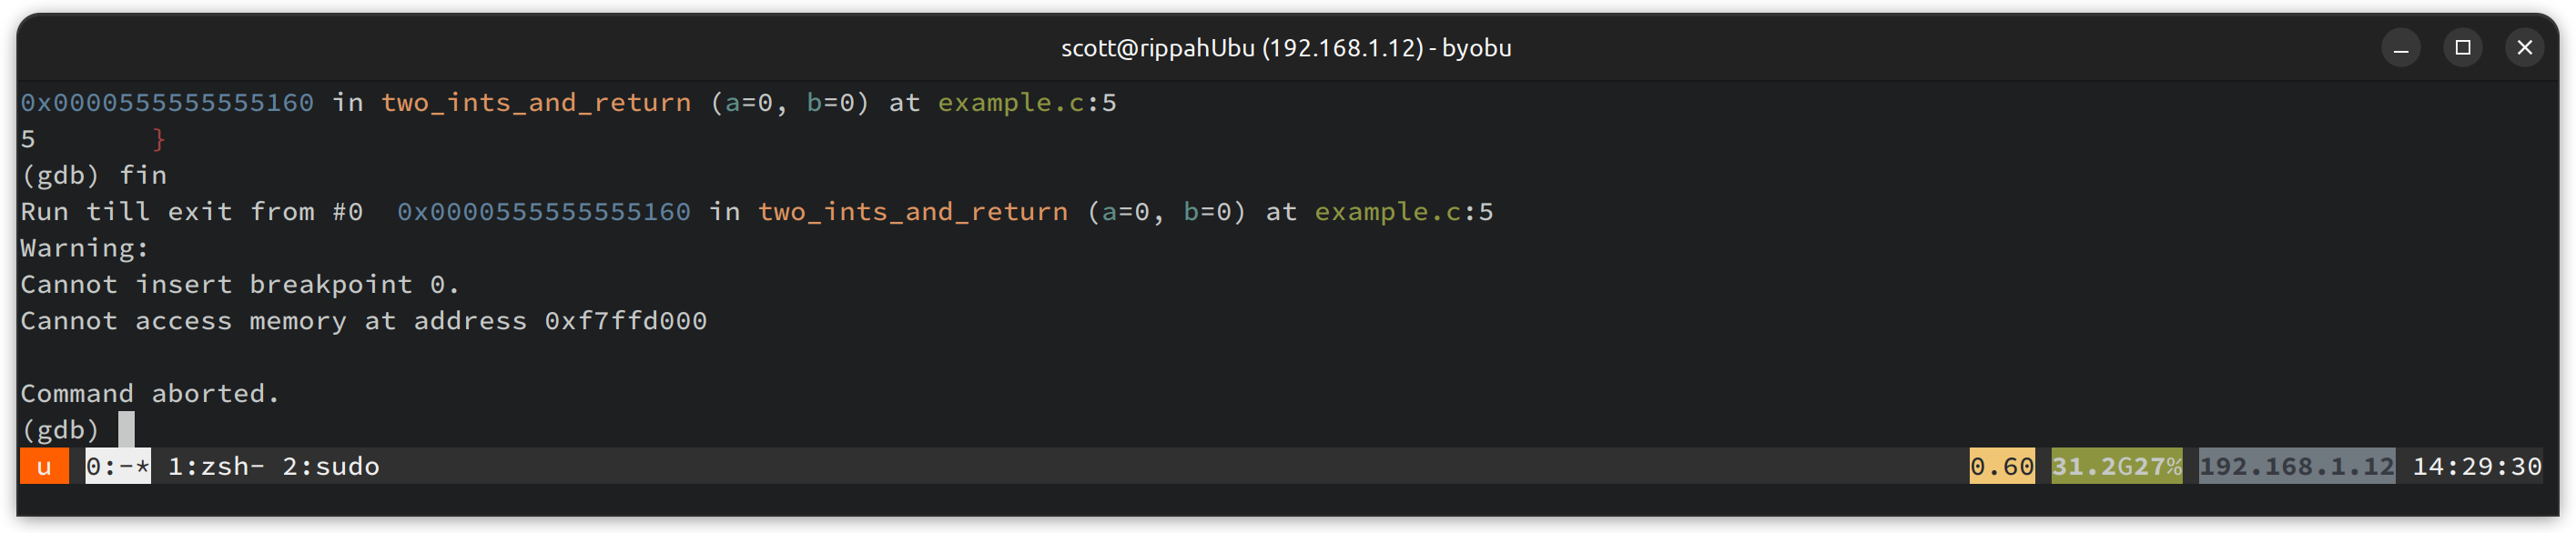
We can't even set a breakpoint there! We can use info proc mappings to see what that memory is mapped from, and low and behold ...
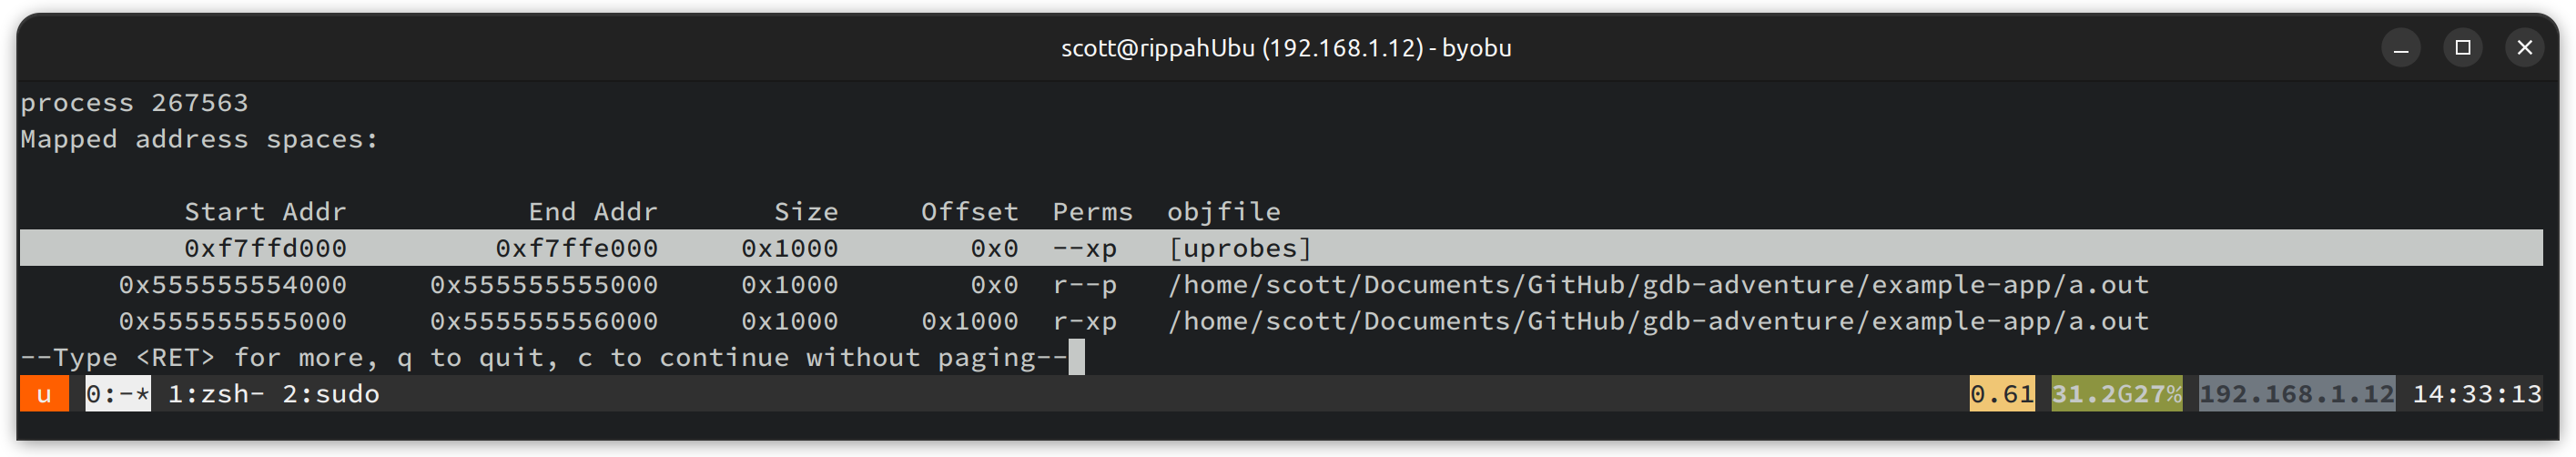
Running GDB under sudo doesn't seem to help us reading that memory either. If anyone knows an incantation here, let me know!
In the meantime, we can confirm our theory by testing with both the uprobe alone, and the uretprobe alone, and seeing what the stack and function assembly look like. Results are as follows:
uprobealone - function starts withint3, nop; stack is normal - e.g., no "ghost frames" - themainframe appears directly abovetwo_ints_and_returnuretprobealone - function starts withint3, nop; stack is manipulated with extra frames running through the[uprobes]memory region.
Too long, didn't read: Both uretprobe and uprobe swap out the first instruction of the function with a soft interrupt ( int3) and padding as required. In the uprobe case, this is used to jump into the handler directly, in the uretprobe case, this is used to manipulate the stack such that the return will run through the uretprobe handler before returning back to the actual caller function!
So where are the functions themselves?
For the uprobe, the INT3 will context switch us into the kernel, where the eBPF virtual machine runs the program associated with the probe, before returning to user space and continuing to execute as normal. uretprobe will use a similar mechanism, but the details of this are obscured by the memory protection on the portion of the process mapped in to handle the return. I'm sure there are ways to read that out (core dump ....?) - but I think that's enough for today!