eBPF is a set of tools that lets us inject programs into the Linux kernel at runtime, attaching them to events in the Kernel and user space, and doing interesting things with those events. Now we can extend the kernel without rebuilding, and as the programs are run through a verifier at load time, do it in a safe, reliable fashion.
“Interesting things” can range from implementing flexible network firewalling - the original purpose of eBPF - to end-to-end observability, security & network controls (cilium), performance monitoring (BCC), load balancing (katran), and all sorts of other exciting things. It’s hard to overstate how many new use cases it makes practical - there’s a great primer on this stuff over at eBPF.io.
I have yet to play with eBPF directly, besides using tools like cilium and Brendan Gregg’s rather comprehensive eBPF tools.
A toy project - Dumping unencrypted SSL traffic
I learn how stuff works by building things with the aforementioned stuff. To get a proper grasp on eBPF, I’ll build a program that leverages eBPF to intercept SSL traffic in user-space, capturing data before it is encrypted (outgoing messages) and after it is decrypted (incoming messages). This’ll let us read wire-encrypted SSL traffic on our local system without proxies, or having to meddle directly with the processes involved.
Step 1 - How’s curl do SSL?
Let’s start by seeing how curl works, with an eye to understanding what it’s using for SSL. I’ll go through the process I used to work out what’s going on here, rather than jumping straight to the “…and that’s how it works” part.
I’ve spent a fair bit of time working in C-land, and figure a good place to start is dumping the shared objects used by curl:
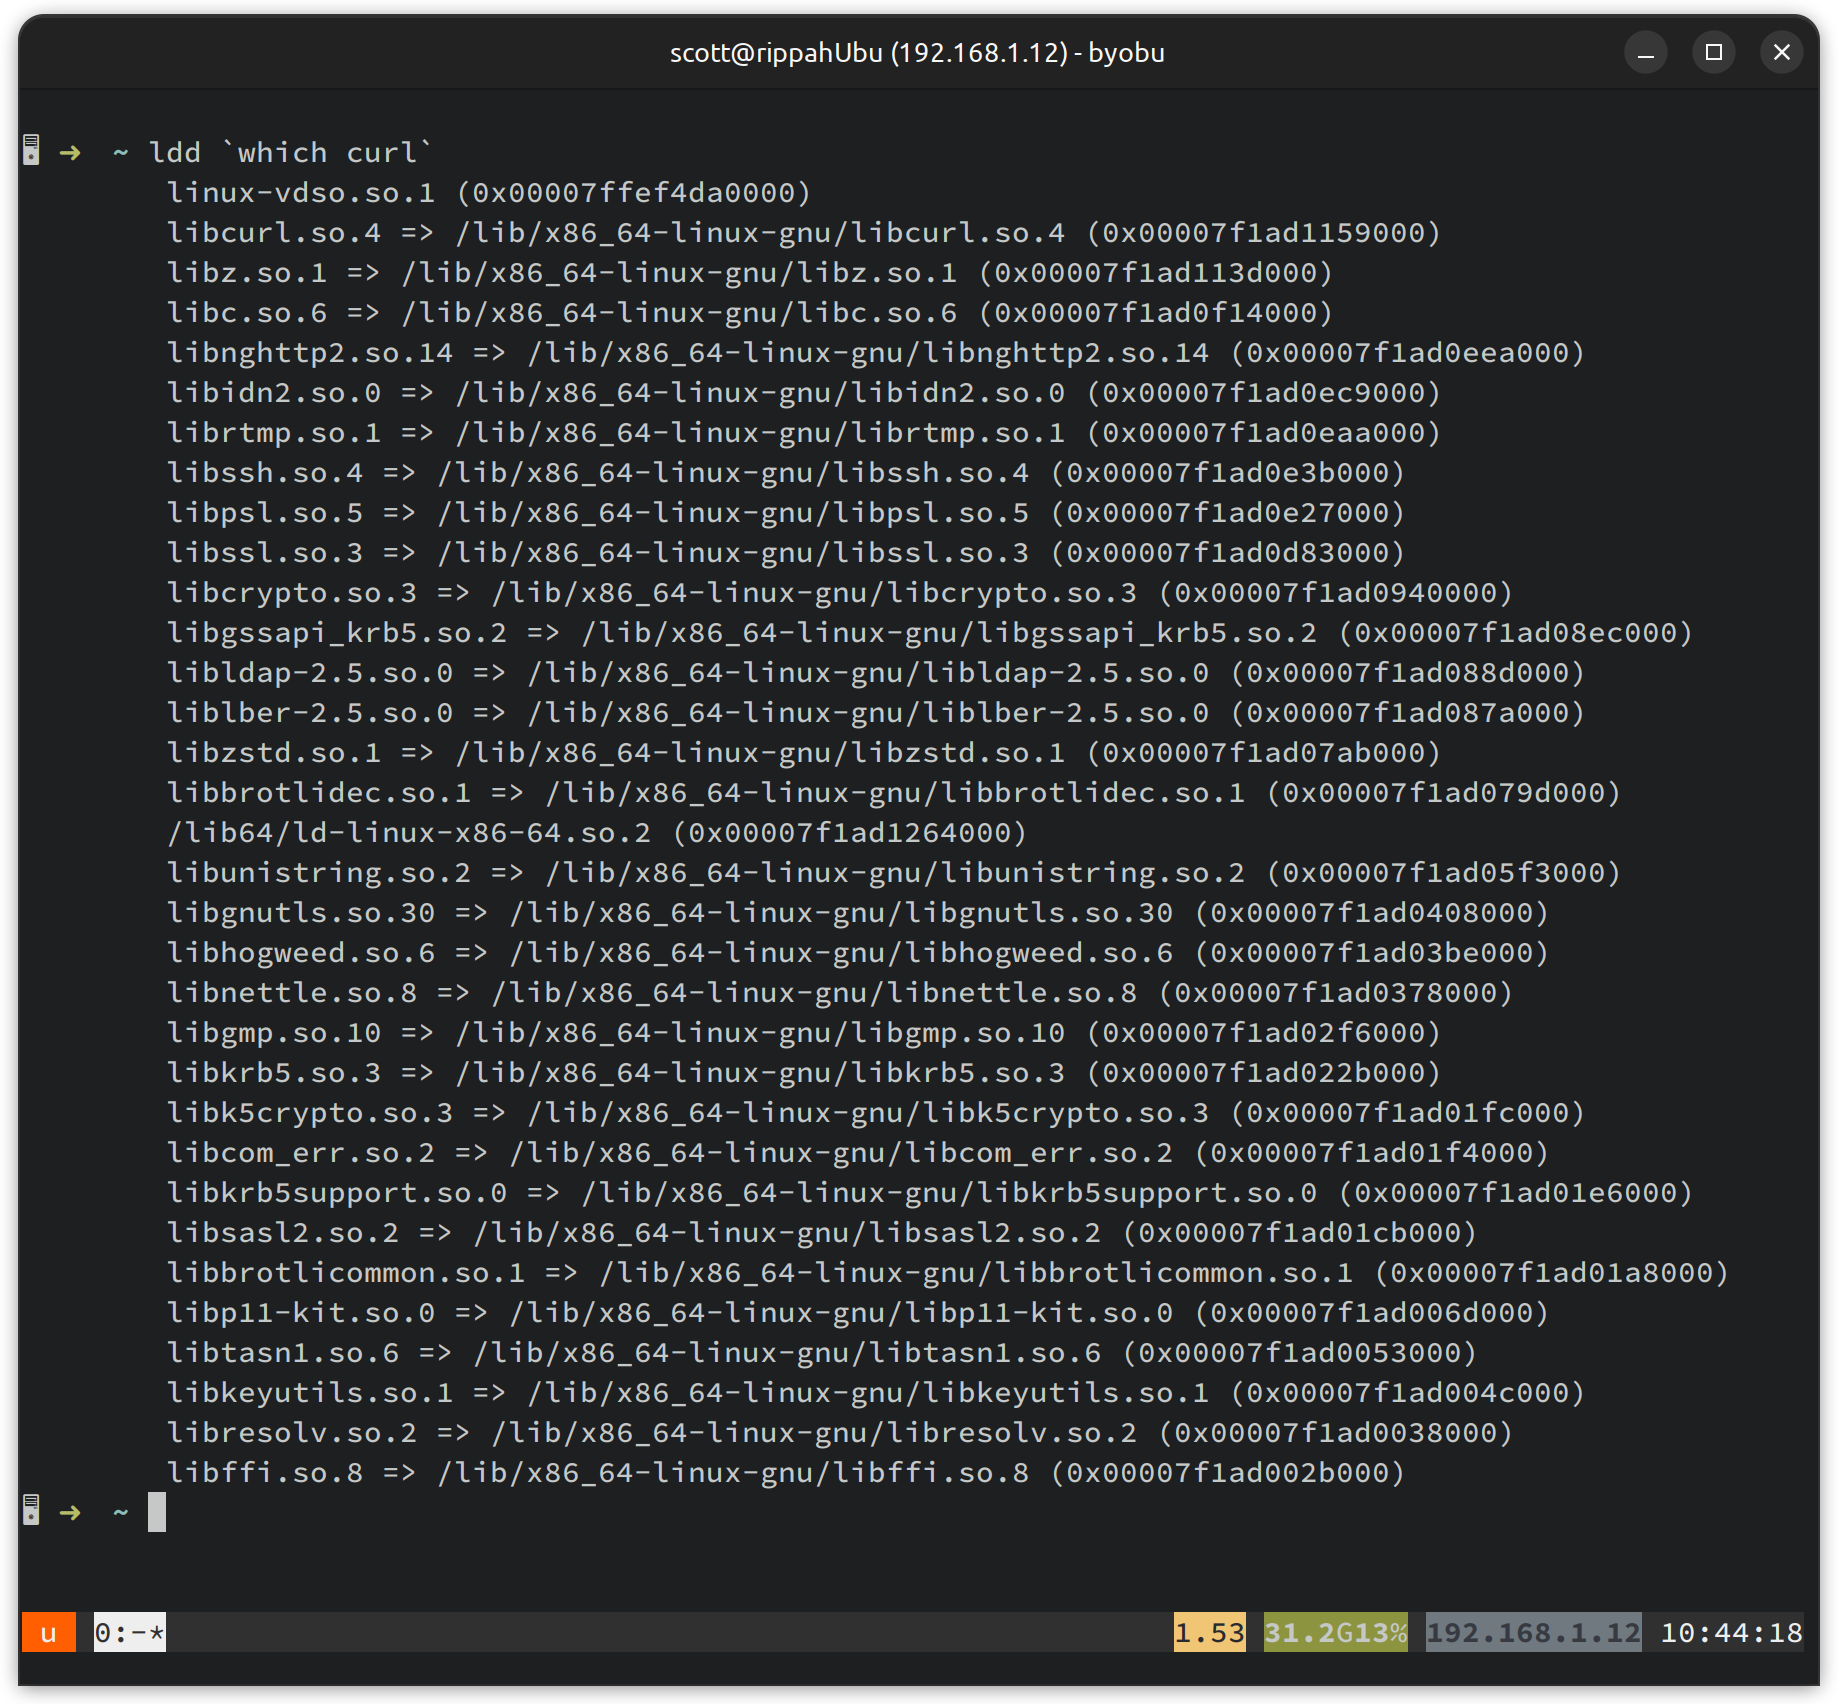
Looks like we’ve got libssl.so.3, which is part of OpenSSL 3.0. Let’s check what exports it has, so we can try and work out what we want to hook. We can use ltrace to watch dynamically linked library calls - maybe we’ll see it using libssl to do something:
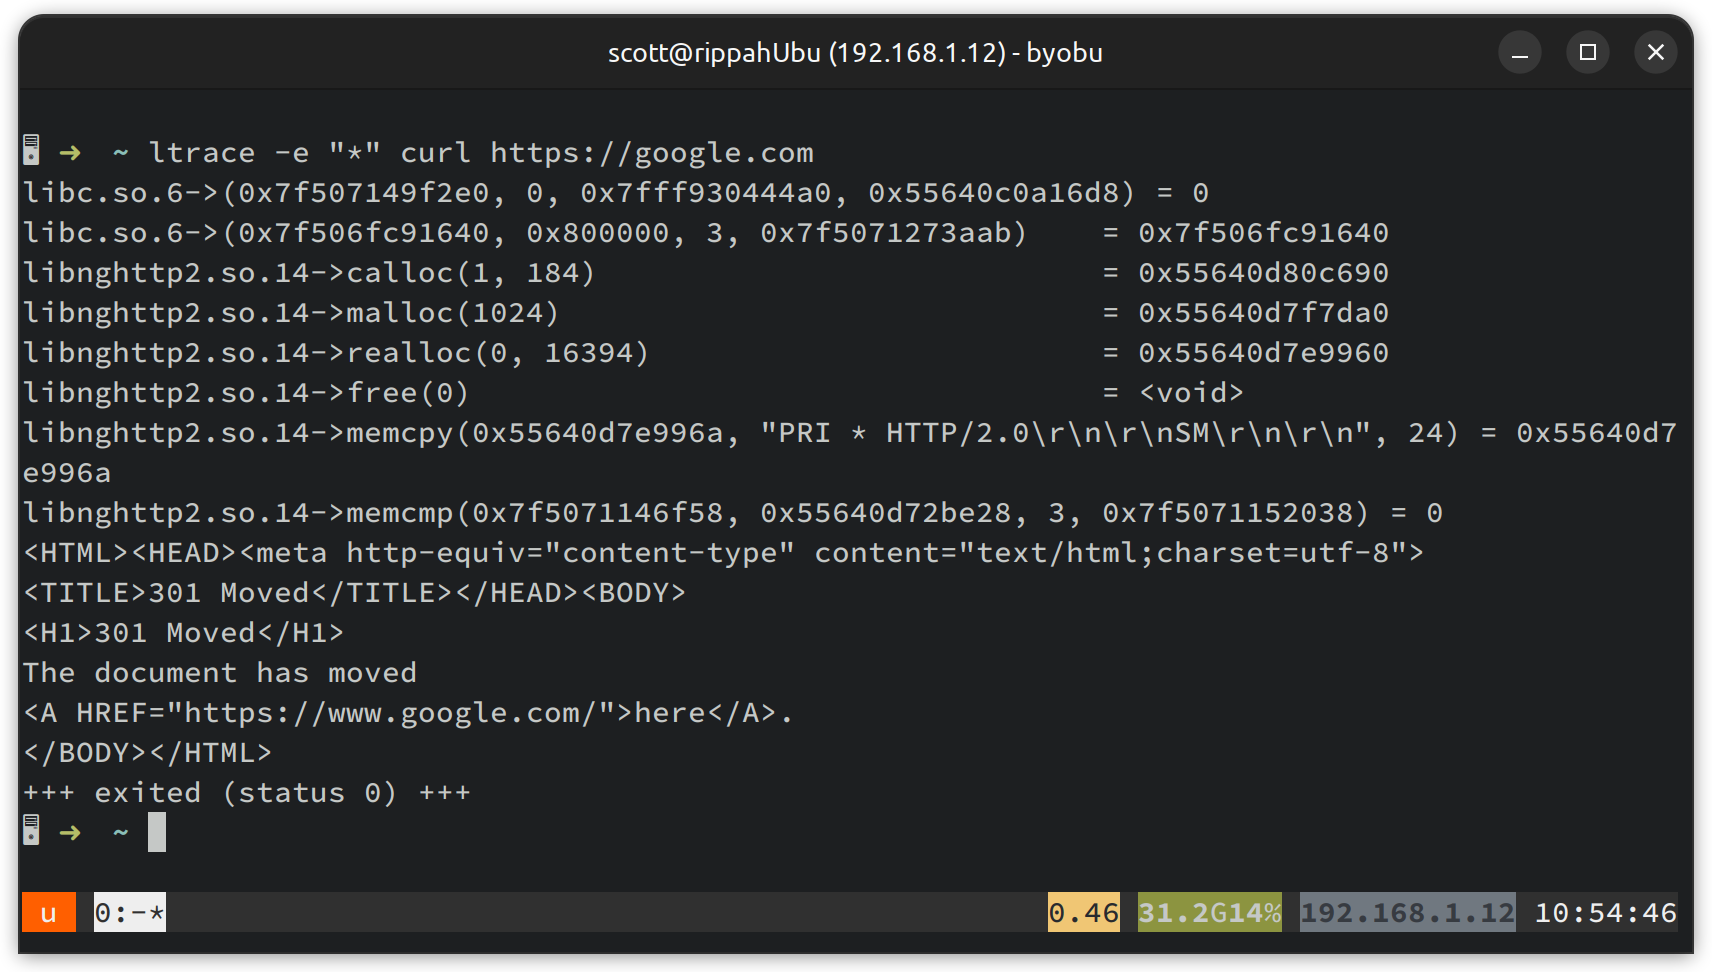
Whoops - there’s no libssl, but there is libnghttp2. If we add -S to include system calls, we get a lot more output, but it doesn’t help, much. We can see we call read to read some OpenSSL configuration. Let’s use a debugger, set a breakpoint on read, and see what our stack looks like when we hit it. Hopefully this will go through OpenSSL and we have a thread to pull:
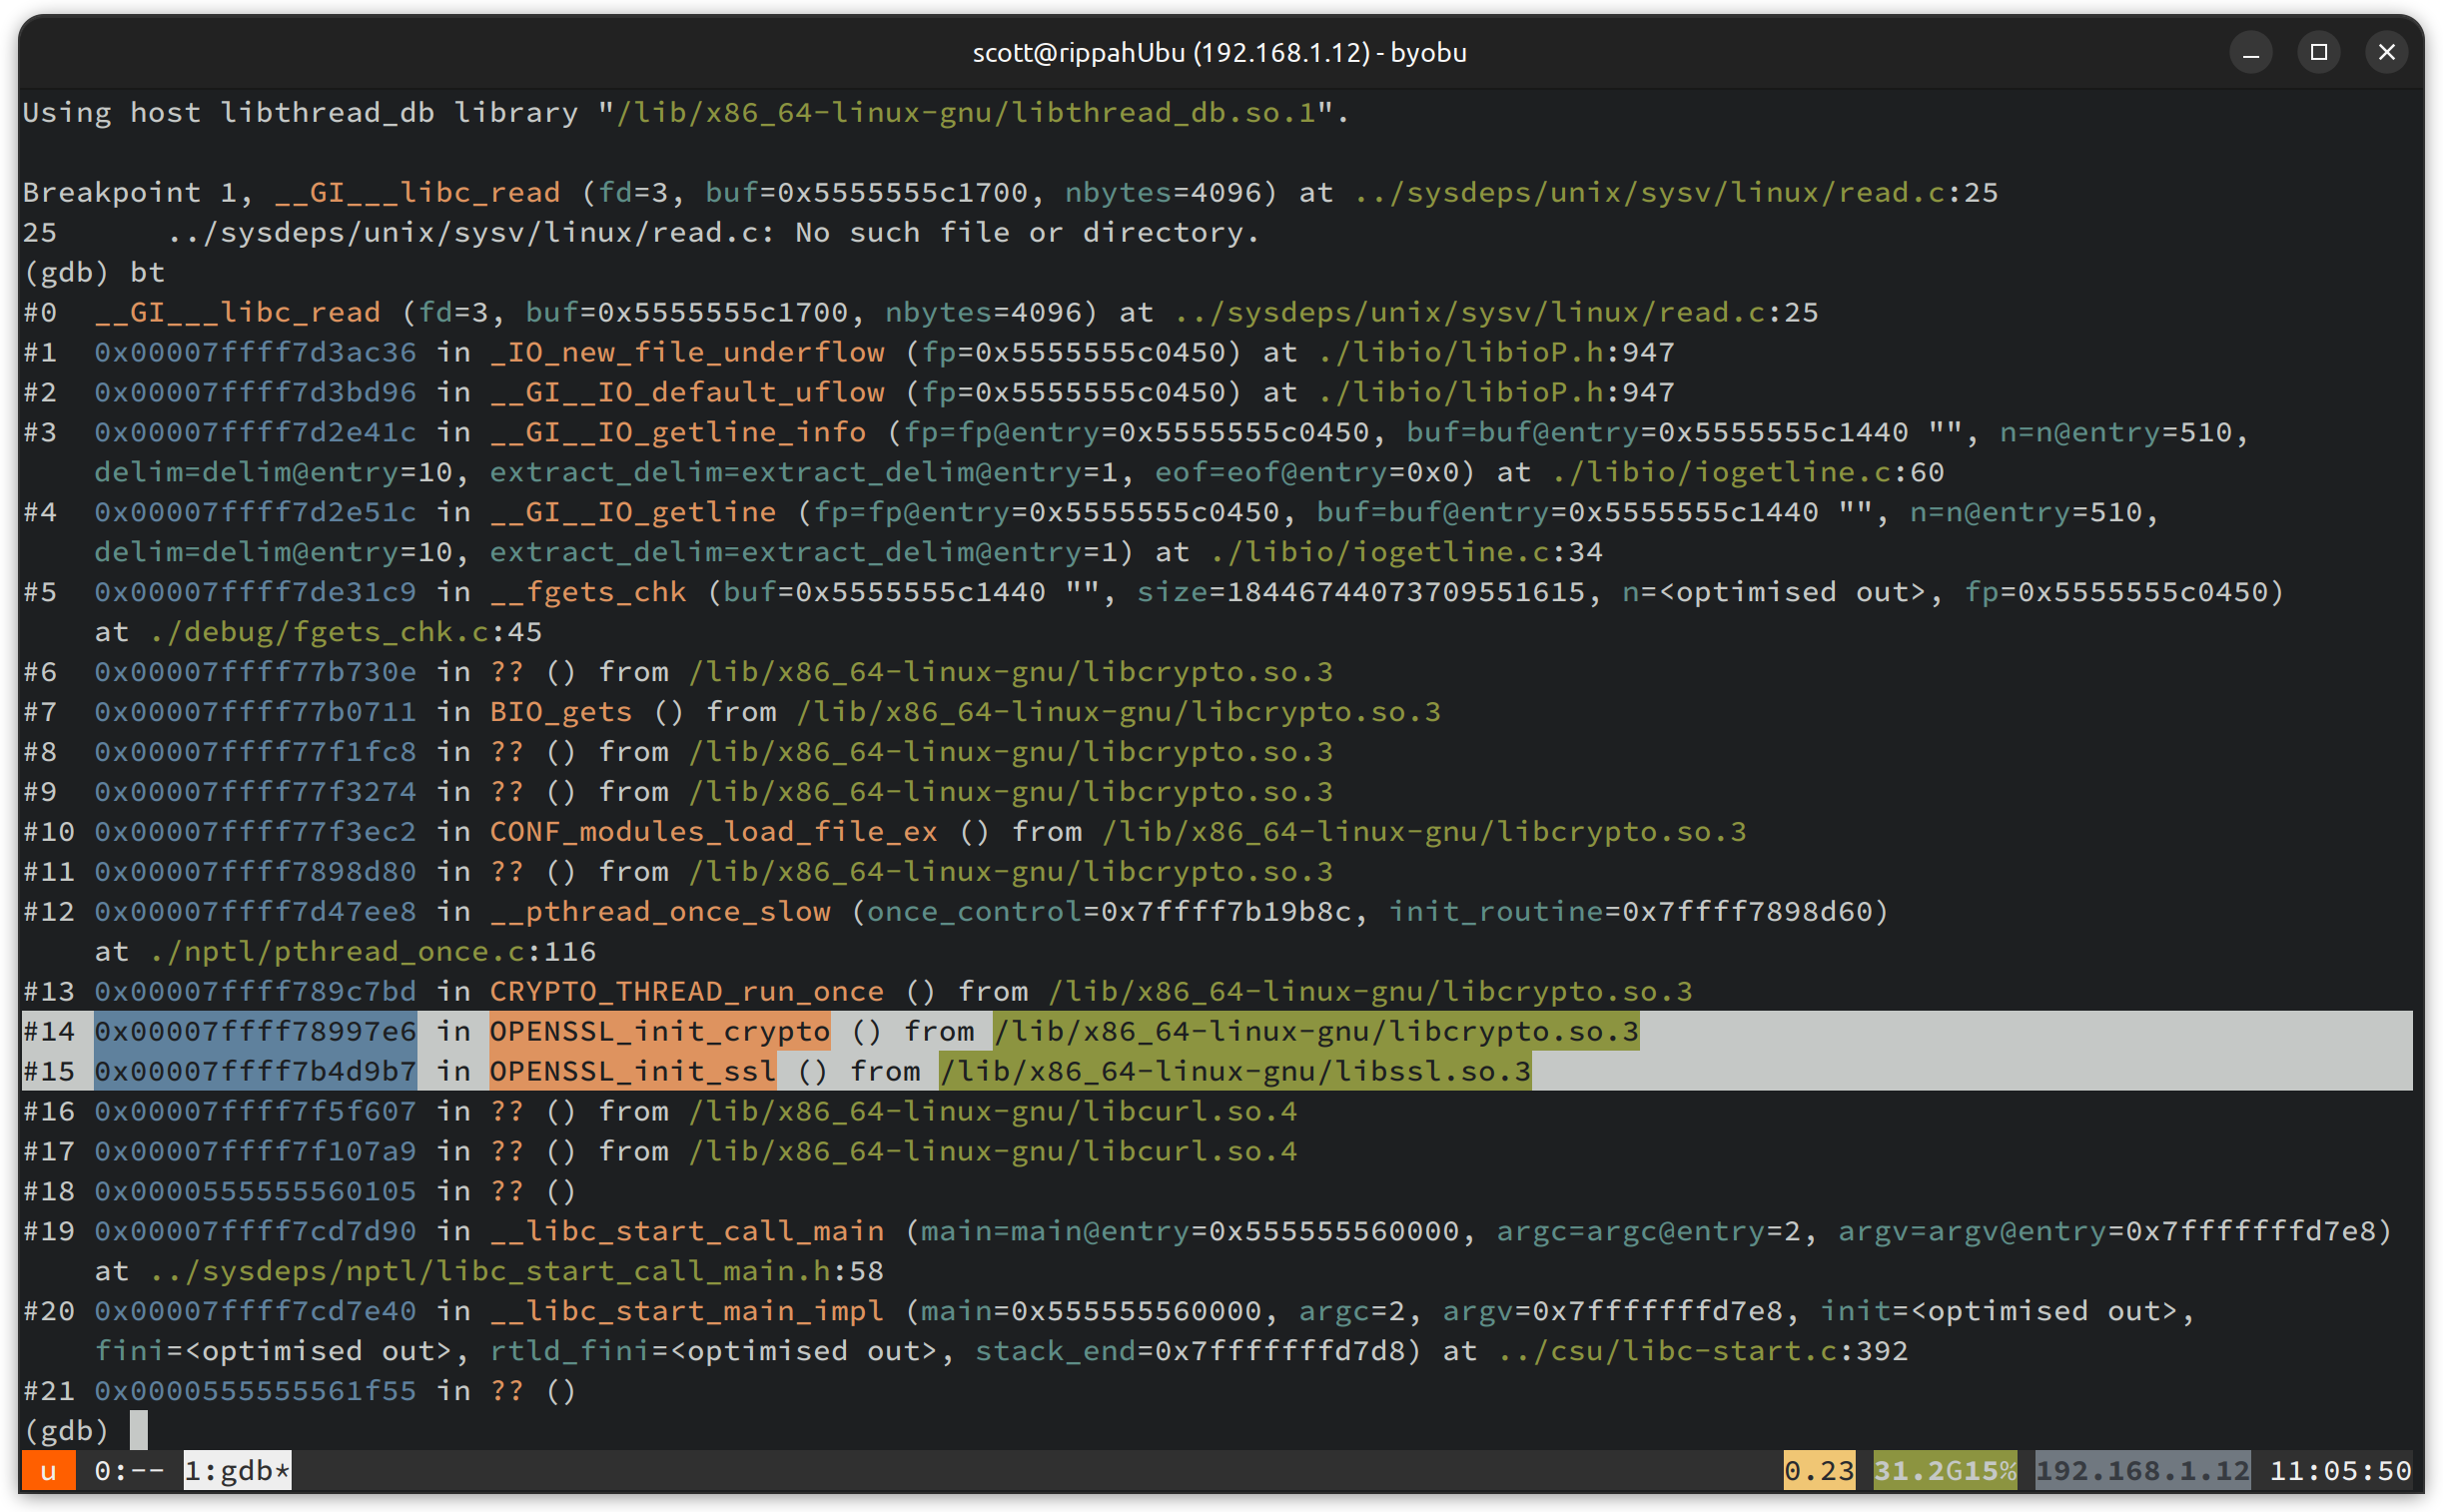
Look! Some OpenSSL frames right in the middle there. Looks like we’ve caught OpenSSL starting up, as we’d hoped. Let’s set some other breakpoints and see if we can catch its involvement in encryption - looks like we can use rbreak SSL.* to catch every call through the library.
Running through these breakpoints, there’s lots of noise in there, and it seems a fair bit is internal details of OpenSSL. A bit more of a look around the symbol tables reveals SSL_read and SSL_write . Let’s break on them, and see if we can get some info out on how they are being called:
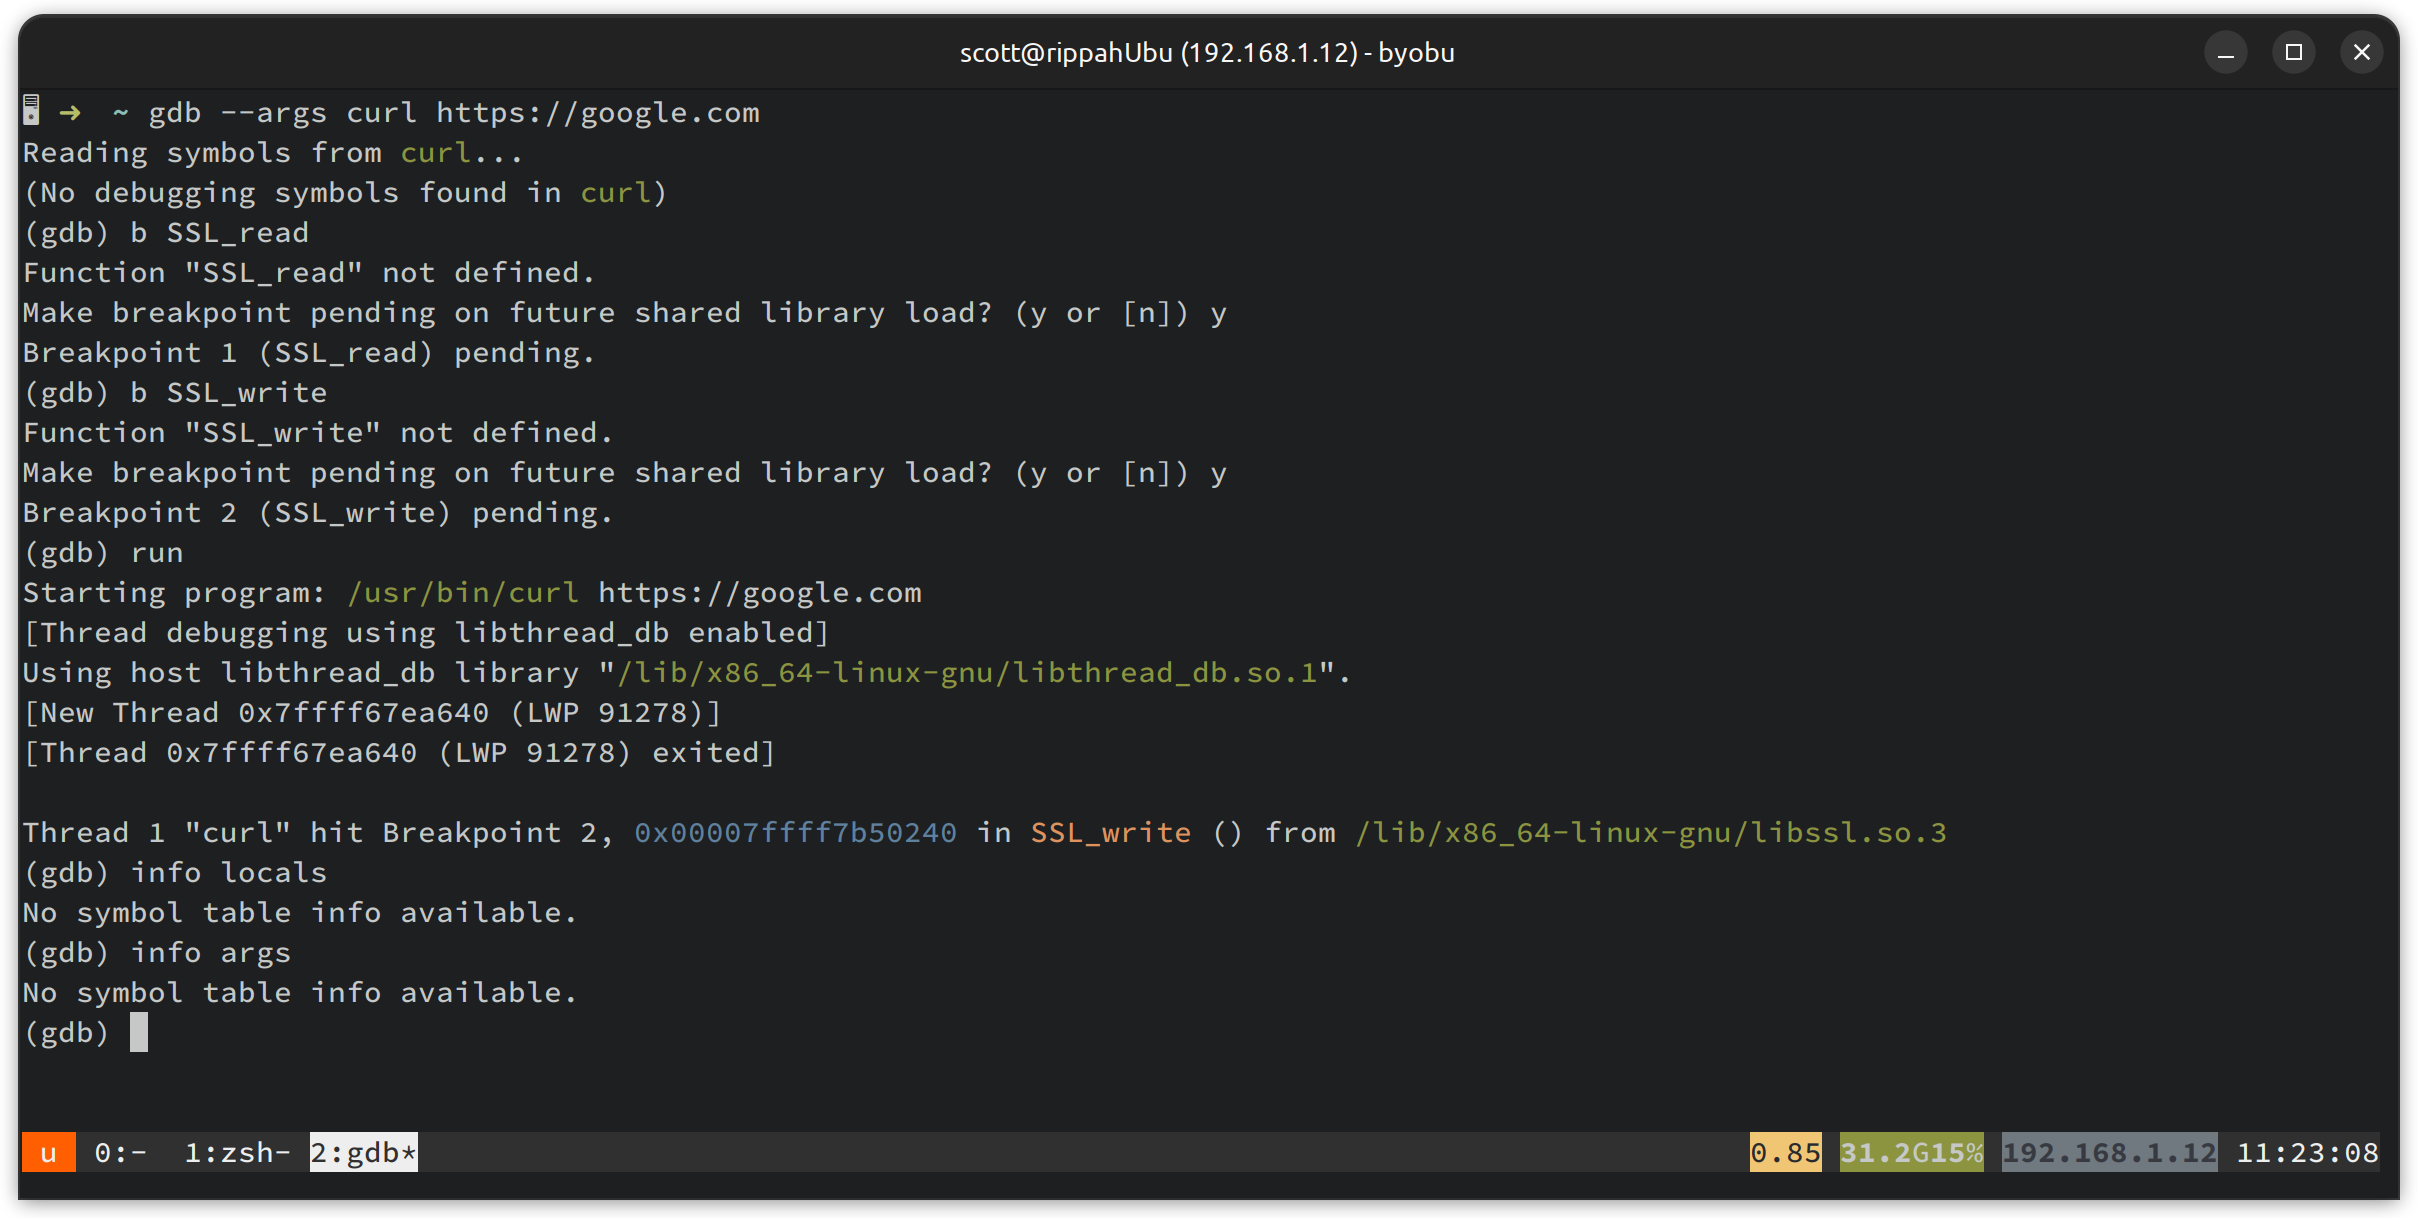
We can’t easily see the locals or the args, because we don’t have a build of curl with symbols - we have a normal release build that’s been stripped.
Let’s park this debugging adventure for the moment - we have enough information to see that SSL_read and SSL_write are what we want, and we can see their method signatures in the OpenSSL manual anyway.
Step 2 - What tooling do we need to app-ify this?
Now we know that to capture curl’s traffic, we need to userspace-hook SSL_write and SSL_read from the OpenSSL library. I know that eBPF has userspace probes that I want to use for this, but I still need some tooling to develop in. A casual google turns up a bunch of options - ebpf-go for golang, libbpf-rs for rust, and libbpf for C. There’s also a bunch of tools you can use to save writing the userspace part - but as this is a journey of discovery, I’ll discard those.
Based entirely on vibes (and github popularity!) i’ve decided to start with ebpf-go. It’s part of the Cilium project, is very well documented, and pops up constantly when you google in the eBPF domain.
Step 3 - Pulling apart an example
First we need to decide what sort of probe we need - there’s all sorts - kernel functions, user-space functions, hardware events, etc. In our case we know we need user probes - which brings us to uprobe and uretprobe. Looking at the API documentation for SSL_read and SSL_write, we see that we have a buffer and a length as the second and third arguments of each function call. In the write case, the buffer contains the unencrypted payload when the function is called, in the read case, the buffer is filled with the decrypted payload once the function has completed (and the return code of SSL_write indicates the number of bytes read).
ebpf-go has a great example of uretprobe we can start with - main.go is the user-space part - that loads the eBPF program and reads its output - and uretprobe.c is the eBPF itself. Some bits jump out —
First, the data interface between the eBPF and the user-space program. We can see we return “events” that contain the process ID and some text. BPF_MAP_TYPE indicates we have a BPF map, which are the storage types supported by eBPF. These aren’t all hashmaps despite the naming.
struct event {        u32 pid;        u8 line[80];};
struct {        __uint(type, BPF_MAP_TYPE_PERF_EVENT_ARRAY);} events SEC(".maps");
In main.go, we can see these events being read out:
  // Open a perf event reader from userspace on the PERF_EVENT_ARRAY map  // described in the eBPF C program.  rd, err := perf.NewReader(objs.Events, os.Getpagesize())
  // ...
  var event bpfEvent  for {      record, err := rd.Read()
      // ...
      // Parse the perf event entry into a bpfEvent structure.      if err := binary.Read(bytes.NewBuffer(record.RawSample), binary.LittleEndian, &event); err != nil {          log.Printf("parsing perf event: %s", err)          continue      }
Sticking with main.go, we can also see how we attach the probe to some user-space function - specifying the binary in question. In our case, we will need to provide the path to the openSSL so that we want to hook:
const (  // The path to the ELF binary containing the function to trace.  // On some distributions, the 'readline' function is provided by a  // dynamically-linked library, so the path of the library will need  // to be specified instead, e.g. /usr/lib/libreadline.so.8.  // Use `ldd /bin/bash` to find these paths.  binPath = "/bin/bash"  symbol  = "readline")
// ...
// Open an ELF binary and read its symbols.ex, err := link.OpenExecutable(binPath)if err != nil {    log.Fatalf("opening executable: %s", err)}
// Open a Uretprobe at the exit point of the symbol and attach// the pre-compiled eBPF program to it.up, err := ex.Uretprobe(symbol, objs.UretprobeBashReadline, nil)if err != nil {    log.Fatalf("creating uretprobe: %s", err)}defer up.Close()
Finally, in the eBPF, we see the probe itself:
SEC("uretprobe/bash_readline")int uretprobe_bash_readline(struct pt_regs *ctx) {  struct event event;
  event.pid = bpf_get_current_pid_tgid();  bpf_probe_read(&event.line, sizeof(event.line), (void *)PT_REGS_RC(ctx));
  bpf_perf_event_output(ctx, &events, BPF_F_CURRENT_CPU, &event, sizeof(event));
  return 0;}
At this point, we have a pretty good idea how our program should look.
Step 4 - Code! Code! Code!
For this bit I’ll break the code down by component rather than following along with how I incrementally built it; I think this will be easier to follow.
Let’s start with the probes themselves - we need to hook both SSL_read and SSL_write. We have two options - a uprobe lets us hook a function before it begins running, and a uretprobe after it has completed, before it returns. For write its straightforward enough - the user provides OpenSSL the unencrypted data, so we simply hook a uprobe up and grab that buffer:
SEC("uprobe/lib`ssl_write`")int uprobe_lib`ssl_write`(struct pt_regs *ctx) {
    // From the API docs, we need to read the 2nd and 3rd args    // PT_REGS_PARMx give us convenience macros to extract the CPU register    // values from the ctx pointer.
    // At this point, we already have the unencrypted data and its size  void* buf = (void *) PT_REGS_PARM2(ctx);  u64 size =  PT_REGS_PARM3(ctx);
The read side is a bit more interesting, as the caller provides the encrypted payload. I naively thought I could just use a uretprobe here, but at the point of return, the arguments to SSL_read are no longer in the registers, and we can’t get the buffer the caller provides. This means we need both a uprobe (to get the decryption buffer address) and a uretprobe (to read the decrypted data), and some way of passing the details from the uprobe to the uretprobe, so we can ultimately push it all back to our userspace app. Let’s see what that looks like:
SEC("uprobe/libssl_read")int uprobe_libssl_read(struct pt_regs *ctx) {
  // Get a map element we can store the user's data pointer in    // We always get the 0th element from the array.  u32 zero = 0;  struct ssl_read_data *data = bpf_map_lookup_elem(&ssl_read_data_map, &zero);    if (!data)        return 0;
  // Store the address and size of the user-supplied buffer  // that we will read the decrypted data back out of.    // Here we are reading the 2nd and 3rd parameter in the same    // fashion as we do with `SSL_write`.  data->buf = PT_REGS_PARM2(ctx);  data->len = PT_REGS_PARM3(ctx);
  return 0;}
// Once we libssl_read is complete, we can grab the buffer// again, and read the decrypted results back out of it.SEC("uretprobe/libssl_read")int uretprobe_libssl_read(struct pt_regs *ctx) {
  // Get the data from the uprobe for read back  u32 zero = 0;  struct ssl_read_data *data = bpf_map_lookup_elem(&ssl_read_data_map, &zero);    if (!data)        return 0;
    // ....
    // Return code of SSL_read is the number of bytes decrypted  // If we got none, we can bail out.  u64 size = PT_REGS_RC(ctx);  if (size == 0) {    return 0;  }
    // Now we have everything we need to return data to the user
At this point, we need two “external stores” - places to stash data that aren’t on the stack. The first is obviously to pass data back to user-space so we can get at our unencrypted data. We will need this mechanism for both read/write. The second is so we can pass the buffer address and length from the uprobe to the uretprobe.
The mechanism for this in eBPF world is the “map”. These aren’t just dictionaries/hashmaps, but rather a bunch of general-purpose data structures we can use to share data between eBPF programs and user space - including hashmaps, arrays, ringbuffers and so on.
Let’s start with how we share data between the two “read” probes. For this, we will use a per-CPU array (BPF_MAP_TYPE_PERCPU_ARRAY), and simply set the 0th element of the array to the data we want to share. We can see the retrieval of the data from the map in uprobe_libssl_read above; the definition of the map looks like this:
// The record we want to store itselfstruct ssl_read_data{  u32 len;  u64 buf;};
// The definition of the eBPF map. Note the section// reference (".maps") telling the compiler where to put// this in the output binary, the maximum array size of 1,// and the reference back to the concrete struct we store in the arraystruct {    __uint(type, BPF_MAP_TYPE_PERCPU_ARRAY);    __uint(max_entries, 1);    __type(key, u32);    __type(value, struct ssl_read_data);} ssl_read_data_map SEC(".maps");
To send data back to userspace, we use a ring buffer (BPF_MAP_TYPE_RINGBUF). This gives us a lock-free way of pushing data back to the userspace, at the expense of potentially overwriting entries that have not yet been read, if userspace fails to keep up. For our use cases, this is fine. The definition looks like this:
// Record we write back in our ringbuff to user space#define MAX_BUFF_SIZE 80struct ssl_data_event_t {  u32 pid; // Process ID that is writing the data  u32 len; // Length of the data within the buffer  char is_outgoing; // 1 if outgoing, 0 if incoming  u8 buf[MAX_BUFF_SIZE]; // Data itself};
// The definition of the eBPF map.struct {  __uint(type, BPF_MAP_TYPE_RINGBUF);  __uint(max_entries, 1 << 24); // enormous max_entries taken from examples probably unnecessary!
} ssl_data_event_map SEC(".maps");
To write to the map, we have another function available to us:
struct ssl_data_event_t* map_value = bpf_ringbuf_reserve(&ssl_data_event_map, sizeof(struct ssl_data_event_t), 0); if (!map_value) { return 0; }Finally, to access this from user-space, using ebpf-go:
// Open a ringbuf reader from userspace RINGBUF map described in the// eBPF C program.rd, err := ringbuf.NewReader(objs.SslDataEventMap)if err != nil {  log.Fatalf("opening ringbuf reader: %s", err)}defer rd.Close()
// ....
log.Println("Waiting for events..")
// bpfSslDataEventT is generated by bpf2go from the eBPF struct// definition ssl_data_event_tvar event bpfSslDataEventTfor {    record, err := rd.Read()
    // ...
    // Parse the ringbuf event entry into our bpfSslDataEventT structure.    err := binary.Read(bytes.NewBuffer(record.RawSample), binary.LittleEndian, &event)
    // ...
    // Pull out the subset of the buffer that was used    msg_bytes := event.Buf[0:event.Len]    msg := unix.ByteSliceToString(msg_bytes)
    // Print this out helfpully to the console    msg_type := "Sent"    if event.IsOutgoing == 0 {        msg_type = "Received"    }    log.Printf("%s: pid: %d size: %d\n%s\n\n", msg_type, event.Pid, event.Len, msg)}
And … that’s the big pieces in place! We can use our new tool to dump out some curl SSL traffic (note that we’re forcing HTTP1.1 here, because HTTP2 adds a framing layer that makes it more complicated to read than simply dumping out the unencrypted session):
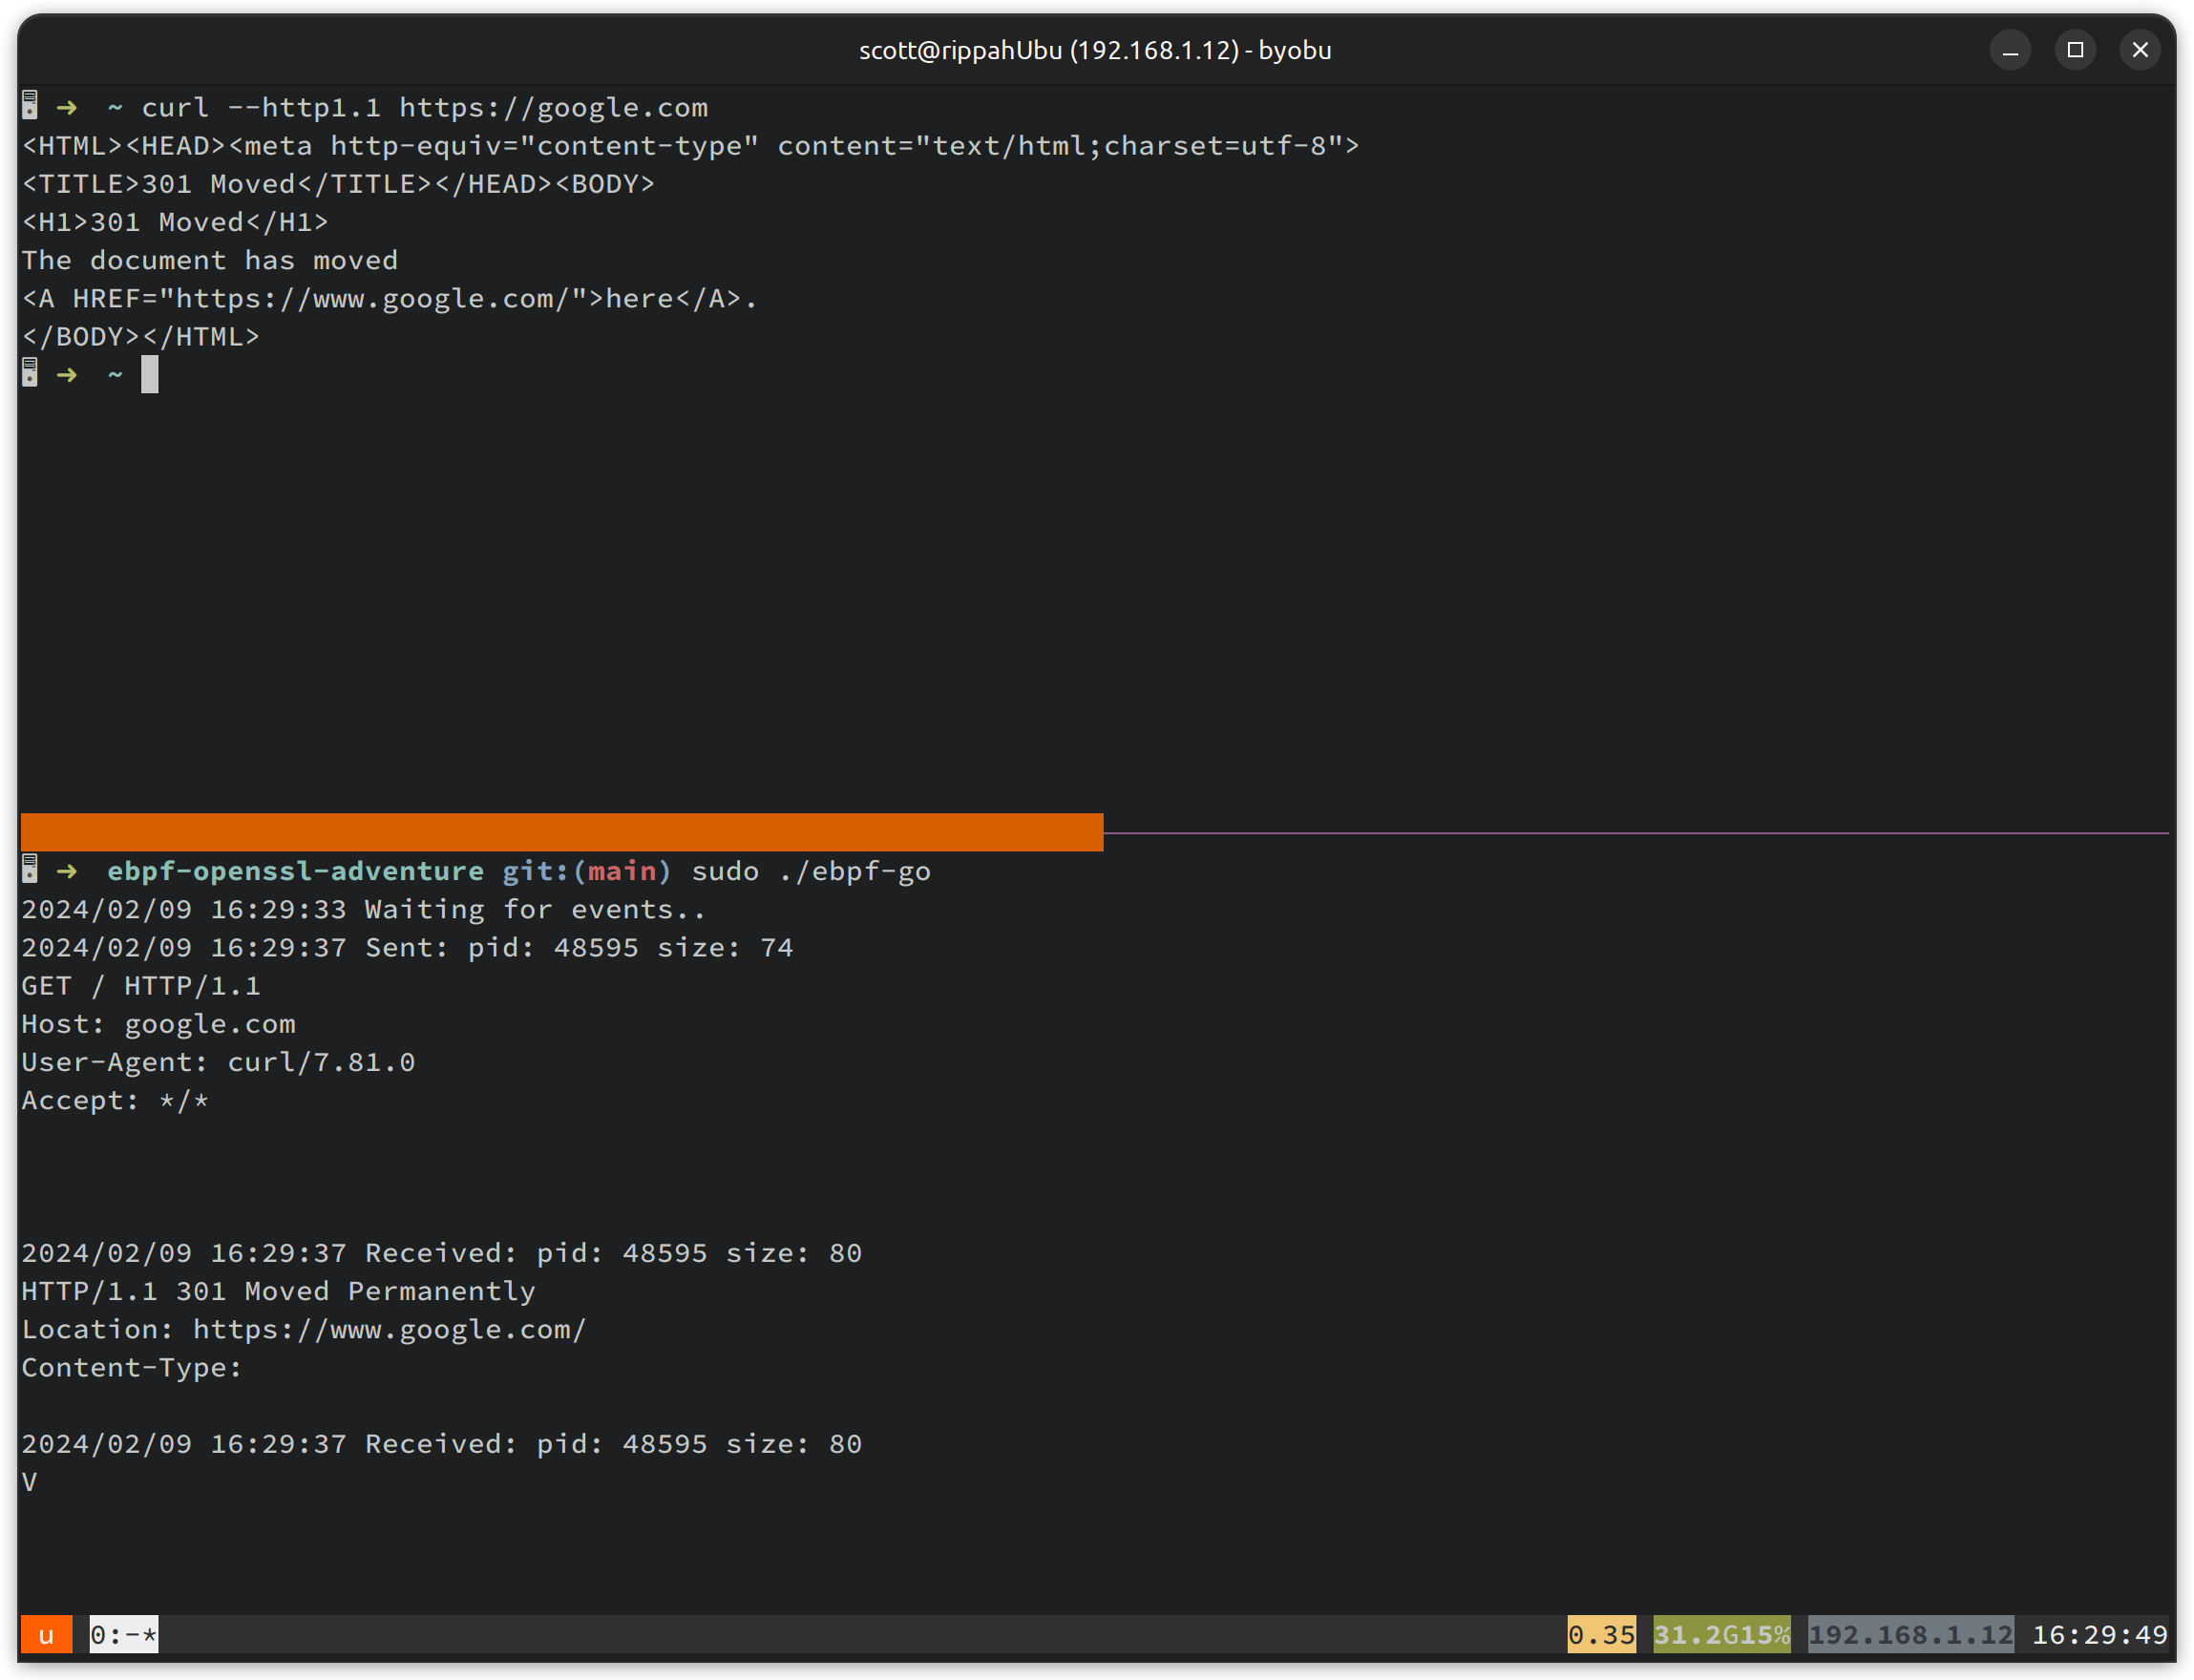
That’s it! It’s not super complete as a tool for dumping SSL sessions, but it was a great toy project to get hands-on with eBPF. And of course - you can grab the whole project off of github if you are interested.
Open Questions
In the interests of not ending up in a bottomless rabbit hole of discovery, here are some open questions I have I will try answer … another day.
We use a per-CPU array to share data between our two “read” probes, assuming that the function we are book-ending does not get preempted onto another CPU between the probes. If this happened, we wouldn’t be able to find our data, or we’d find data from an unrelated invocation! I’m not sure if this assumption always holds.
When I attach a debugger to a process and dump out the values of registers, what I am reading, actually? Have the registers been shifted into system memory, like during preemption or a context switch, and GDB is simply reading from there?
How are the userspace probes injected into the process - is it part of the kernel linking the shared objects up when the executable is loaded? Do the uprobes appear as extra frames in the stack, or, are they “weaved” into the start and end of the function they are hooking?
