Swiss Public Webcams Spelunkomania
/ 3 min read
Here in Switzerland, we have a huge number of Roundshot webcams floating about in the mountains, producing 360 degree panoramas for public consumption every 10 minutes. These are great for ski weather assessment 1 as well as scoping out what different bits of the alps look like.
They also often have quite deep online archives; all the ones I frequent go back at least 2 years. Which got me thinking about a year ago - surely we can do something interesting with this! Deferring the “something” part, I wrote a super simple python script hosted on AWS Lambda to scrape the latest image every 10 minutes, chuck it in an S3 bucket, and work out the average colour of the frames taken from the Heiligenschwendi roundshot. Then, I forgot about it.
In the process of cleaning up my AWS account last week, I stumbled back across this, and figured it was a good chance to see what’s shaken out.
… Let’s just average everything?
First I dumped the average colours out into a HTML table, with each row representing a single day - you can see the results here. You can see the day length changing! But otherwise - It’s super … grey-y blue-y … right? It turns out that even with glorious Alpenglühen evenings the average colour is still predominantly boring:

The outliers to the right are days where the last frame from the camera was still in daylight, for whatever reason 🤷♂️
Colorz!
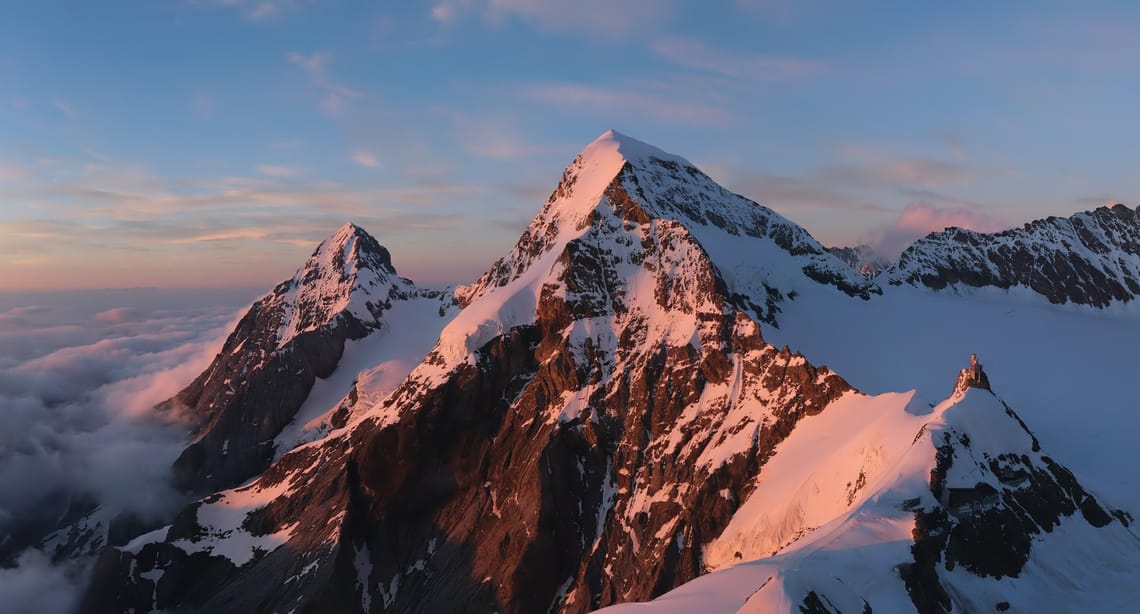
Having seen the visual misery of averages, and as an enthusiastic user of pywal, I was aware of colorz - essentially you give it an image and the number of dominant colours you want to extract, and it gives you a list of said colours. Here’s a timelapse taken from the Jungfrau Ostgrat with some pretty colours in …
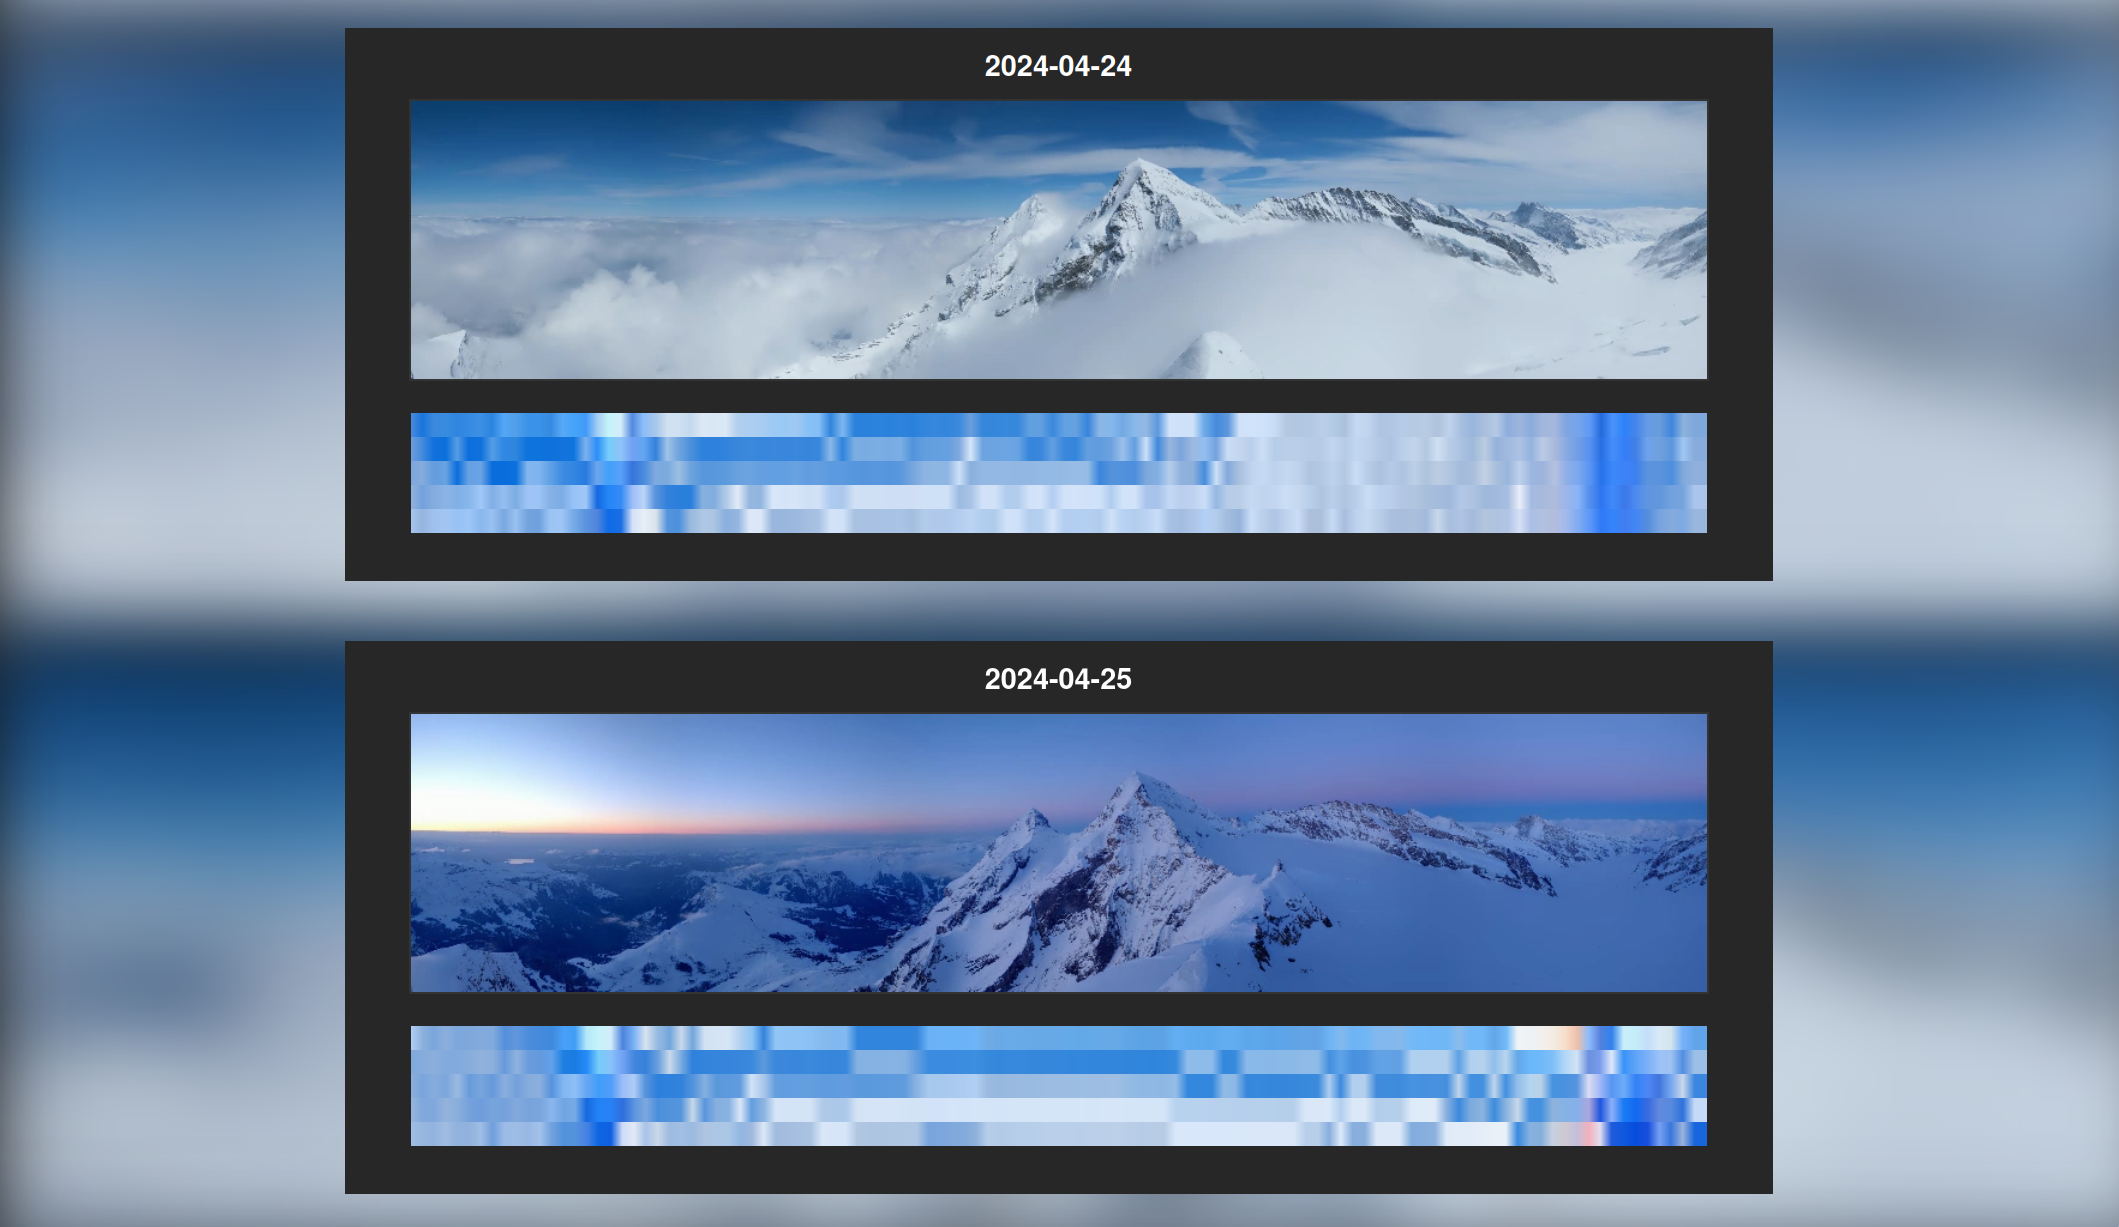
… and what that looks like as a table of colorz-colours for each frame, time progressing horizontally - you can see the sunset colours as a strip towards the end:

Pretty happy with this, I’ve built a bunch of these for the last few months, and skimmed over them visually to look for interesting outliers. The output of the whole process is a HTML page embedding the videos and colours for each day so I can quickly skim over there for a given webcam:

Auroras
Check out this one from the 11th of May this year …

What’s all that action at the start?
Snow
Marginally more entertaining than watching paint dry is watching snow melt:
… anyway
There’s not much of technical novelty here; often it’s just fun to grab some public data and see what you can make of it!
Footnotes
-
Check out my locals Grindelwald First the Lauberhorn, and the Jungfraujoch ↩